. 2013 Mar 18;23(3):287-301.
doi: 10.1016/j.ccr.2012.11.020. Epub 2013 Feb 14.

PGC1α expression defines a subset of human melanoma tumors with increased mitochondrial capacity and resistance to oxidative stress

Affiliations

PGC1α expression defines a subset of human melanoma tumors with increased mitochondrial capacity and resistance to oxidative stress

Francisca Vazquez et al. Cancer Cell. .

Abstract

Cancer cells reprogram their metabolism using different strategies to meet energy and anabolic demands to maintain growth and survival. Understanding the molecular and genetic determinants of these metabolic programs is critical to successfully exploit them for therapy. Here, we report that the oncogenic melanocyte lineage-specification transcription factor MITF drives PGC1α (PPARGC1A) overexpression in a subset of human melanomas and derived cell lines. Functionally, PGC1α positive melanoma cells exhibit increased mitochondrial energy metabolism and reactive oxygen species (ROS) detoxification capacities that enable survival under oxidative stress conditions. Conversely, PGC1α negative melanoma cells are more glycolytic and sensitive to ROS-inducing drugs. These results demonstrate that differences in PGC1α levels in melanoma tumors have a profound impact in their metabolism, biology, and drug sensitivity.


Figures

Figure 1
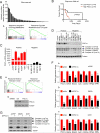
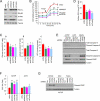
Figure 1. PGC1α Drives the Expression of a Mitochondrial Respiration Program in a Subset of Human Melanoma Tumors and Derived Cell Lines
(A) (a) Relative expression levels of PGC1α in 56 melanoma tumors included in the data set GSEA7553 (Riker et al., 2008). (b) Plots for two of the top gene sets from GSEA analysis of genes positively correlated with PGC1α expression. (B) Kaplan-Meier survival curves for metastatic melanoma tumors with high and low PGC1α expression from dataset GSE19232 (Bogunovic et al., 2009). Survival curves for the 18 metastatic melanoma patients with tumors expressing the 25% highest and lowest PGC1α levels were calculated using Kaplan–Meier analysis with test of statistical significance using the Mantel–Cox log-rank test. The long-rank p value was 0.0230. (C) PGC1α mRNA expression levels in 10 human melanoma cell lines. mRNA levels were quantified using qRT-PCR. Values represent mean ± SD of two independent experiments performed in triplicate. (D) Protein levels of PGC1α and mitochondrial respiration-associated proteins in human melanoma cell lines. (E) (a) Plots for two of the top gene sets of the GSEA analysis in control versus PGC1α knocked-down A375P cells. (b) PGC1α protein levels in the control and PGC1α knocked-down cells. (F) mRNA levels of PGC1α mitochondrial target genes measured using qRT-PCR analysis after PGC1α knock-down in PGC1α positive cell lines: (a) A375P, (b) MeWo and (c) G361. Values represent mean ± SD of three independent experiments performed in triplicate. *p < 0.05 and **p < 0.01. (G) Protein expression levels of mitochondrial respiration-associated proteins and PGC1α in A375P stably expressing a control or PGC1α shRNA. See also Figure S1.
Figure 2
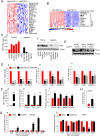
Figure 2. MITF is Necessary to Maintain High Levels of PGC1α Gene Expression in Melanoma Cells
(A) Heat map of the top 20 genes differentially expressed between the top and the bottom 25% melanoma samples ranked by PGC1α expression levels. Expression data was extracted from the GSE7553 data set. The gene list shown is ranked by signal to noise. (B) Heat map of selected differentially expressed between the top and the bottom 25% melanoma samples ranked by PGC1α expression levels. Expression data was extracted from the CCLE database. The rank of the genes by signal to noise is shown. (C) (a) MITF mRNA and (b) protein expression levels in 5 PGC1α positive and 5 PGC1α negative melanoma cell lines. Values represent mean ± SD of three independent experiments performed in triplicate. (D) qPCR analysis of (a) PGC1α, (b) MITF targets and (c) TYR in shRNA MITF melanoma cell lines. Values represent mean ± SD of three independent experiments performed in triplicate. *p < 0.05 and **p < 0.01. (E) Western blot analysis of PGC1α protein expression levels in shRNA MITF melanoma cell lines. (F) qPCR analysis of (a) MITF, (b) MITF targets and (c) PGC1α target mRNAs in A375 melanoma cells ectopically expressing MITF. Values represent mean ± SD of two independent experiments performed in triplicate. *p < 0.05, **p < 0.01 and ***p < 0.001. (G) PGC1α promoter luciferase analysis using transient transfection with the indicated plasmids performed in (a) 293 and (b) A375P cells. Values represent mean ± SD of two independent experiments performed in triplicate. *p < 0.05 and **p < 0.01. A representation of the construct is shown in figure S2D. (H) ChiP analysis at the PGC1α promoter in A375P cells using an antibody against MITF and IgG as a control. Values represent mean ± SD of two independent experiments performed in triplicate. *p < 0.05. See also Figure S2.
Figure 3
Figure 3. PGC1α Defines the Metabolic and Energetic Program of Human Melanoma Cells
(A) Basal and maximal oxygen consumption rates (OCR) in PGC1α positive and negative cells measured in DMSO control or FCCP treated cells. The reserve capacity was calculated by subtracting the basal from the maximum OCR. Values of two independent experiments performed in quadruplicate were averaged. The whiskers in the box plots represent the maximum and the minimum value. (B) (a) Glucose (in the culture media), (b) lactate (in the culture media) and (c) intracellular ATP levels of PGC1α positive compared to PGC1α negative cells. Values of three independent experiments performed in duplicate were averaged. The whiskers in the box plots represent the maximum and the minimum value. (C) (a) Real-time measurement of basal and maximal (after addition of FCCP) OCR and (b) basal OCR in control and PGC1α knock-down cells. Values represent mean ± SD of two independent experiments performed in quadruplicate. **p < 0.01. (D) (a) Glucose (in the culture media), (b) lactate (in the culture media) and (c) intracellular ATP levels in control and PGC1α knock-down cells. Values represent mean ± SD of three independent experiments performed in duplicate. *p < 0.05. (E) (a) Glucose (in the culture media), (b) lactate (in the culture media) and (c) intracellular ATP levels in cells overexpressing PGC1α. A375 cells stably expressing HA-PGC1α were used. Values represent mean ± SD of three independent experiments performed in duplicate. *p < 0.05. See also Figure S3.
Figure 4
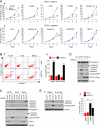
Figure 4. PGC1α is Essential for Survival and Tumor Progression
(A) Cell number analysis in PGC1α knock-down of (a) PGC1α positive and (b) PGC1α negative melanoma cells measured for 4 days after puromycin selection. Values on the graph represent mean ± SD of three independent experiments performed in quadruplicate. *p < 0.05 and **p < 0.01. (B) (a) Annexin V analysis of apoptosis after PGC1α knock-down in PGC1α positive melanoma cells. (b) Quantitation of the percentage of apoptotic cells. Data represent mean ± SD of three independent experiments performed in triplicate. **p < 0.01. (C) Western blot analysis of cleaved apoptotic proteins in PGC1α knocked-down and control melanoma cells. (D) Western blot analysis of cleaved apoptotic proteins in ectopically expressed PGC1α in PGC1α knock-down A375P cells. (E) Apoptosis measured by (a) western blot analysis of caspases and PARP cleavages or (b) Annexin V assays in PGC1α knocked-down and control A375P cells treated with 20 μM Q-VD-OPH (a pan-caspase inhibitor) for 2 days. Values on the graph represent mean ± SD of three independent experiments performed in triplicate. *p < 0.05 and **p < 0.01. See also Figure S4.
Figure 5
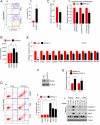
Figure 5. Depletion of PGC1α Triggers an Increase in ROS Levels Causing Apoptosis
(A) (a) Mitochondrial membrane potential measured by the JC-1 dye in PGC1α knocked-down and control A375P cells. (b) Quantitation of the percentage of J-monomer. Values on the graph represent mean ± SD of three independent experiments performed in duplicate. **p < 0.01. (B) ROS levels in control and PGC1α knock-down A375P cells measured using the DCF-DA dye. Values represent mean ± SD of three independent experiments performed in triplicate. *p < 0.05 and **p < 0.01. (C) (a) Total GSH levels and (b) oxidative stress intermediates in PGC1α knocked-down and control A375P cells. Values represent mean ± SD of three independent experiments performed in triplicate. *p < 0.05. (D) Analysis of apoptosis in A375P cells (control and PGC1α knocked-down) treated with 2 mM NAC or 100 μM Trolox for 2 days. (a) Annexin V diagram, (b) quantitation of the percentage of apoptotic cells using the Annexin V assay and (c) western blot analysis of caspases and PARP cleavages. Values on the graph represent mean ± SD three independent experiments performed in triplicate. *p < 0.05 and **p < 0.01. (E) mRNA expression levels of ROS detoxification genes in PGC1α knock-down A375P melanoma cells. Values represent mean ± SD of three independent experiments performed in triplicate. *p < 0.05 and **p < 0.01. (F) Western blot analysis of SOD2 protein levels in A375P cells. (G) SOD2 and GpX1 mRNA levels after ectopic expression of PGC1α in A375 cells. Values represent mean ± SD of two independent experiments performed in triplicate. *p < 0.05. See also Figure S5.
Figure 6
Figure 6. Induction of ROS-Mediated Apoptosis by Depletion of Mitochondrial Respiration PGC1α Target Genes
(A) Depletion of PGC1α and mitochondrial proteins in A375P melanoma cells. (B) Real-time measurement of basal and maximal (after addition of FCCP) OCR after knock-down of the indicated genes encoding mitochondrial proteins in A375P. Values represent mean ± SD of two independent experiments performed in triplicate. *p < 0.05 and **p < 0.01. (C) (a) Glucose (in the culture media), (b) lactate (in the culture media) and (c) intracellular ATP levels in A375P after knock-down of the indicated mitochondrial genes. Values represent mean ± SD of three independent experiments in duplicate. *p < 0.05. (D) Cellular GSH levels in A375P after knock-down of the indicated mitochondrial genes. Values represent mean ± SD of three independent experiments in duplicate. *p < 0.05. (E) Western blot analysis of apoptotic markers after knock-down of the indicates genes mitochondrial proteins in PGC1α positive cells. (F) ROS levels, measured by DCF-DA fluorescent dye, after depletion of mitochondrial proteins in A375P or A375 cells. Values represent mean ± SD of three independent experiments in duplicate. *p < 0.05 and **p < 0.01. (G) Protein expression levels of cleaved-PARP after depletion of mitochondrial proteins in A375P cells treated with the indicated antioxidants.
Figure 7
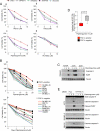
Figure 7. PGC1α Expression Decreases Apoptotic Sensitivity to ROS-Inducing Drugs in Human Melanoma Cells
(A) Cell viability, measured using cell titer glo, after treatment with (a) PEITC, (b) H2O2, (c) piperlongumine and (d) PLX4032 in A375P cells stably expressing the indicated shRNAs. Values represent mean ± SD of three independent experiments in triplicate. (B) Cell viability of PGC1α positive and negative melanoma cell lines treated with piperlongumine at (a) different concentrations and (b) times. Values represent mean of three independent experiments in triplicate. (C) Analysis of cleaved Caspase-9 and PARP in two PGC1α positive (A375P and G361) and one PGC1α negative (A375) cell lines treated with piperlongumine. (D) ROS levels in PGC1α positive melanoma cell lines treated with piperlongumine. Values of three independent experiments performed in duplicate were averaged. The whiskers in the box plots represent the maximum and the minimum value. (E) Analysis of apoptosis using cleavage of apoptotic markers in PGC1α negative melanoma cell lines ectopically expressing PGC1α and treated with piperlongumine. See also Figure S7.
Figure 8
Figure 8. PGC1α Expression Decreases Apoptotic Sensitivity to ROS-Inducing Drugs in Human Melanomas
(A) (a) Tumor volume analysis of xenografts of A375P cells expressing shRNAs against PGC1α or control shRNAs. 15 days after cell injection, mice were injected daily with piperlongumine (1.5 mg/kg) or DMSO. The tumor growth curves are plotted as mean ± SEM (n = 10, each group). Statistical significance of tumor volumes were calculated by one-way ANOVA with a Tukey post test; *p < 0.05; **p < 0.01, DMSO vs piperlongumine; #p < 0.05, DMSO/control shRNA vs DMSO/PGC1α shRNA; &p < 0.01, piperlongumine/control shRNA vs piperlongumine/PGC1α shRNA. (b) In the box plots, final tumor volumes are represented (n=10). The whiskers in the box plots represent the maximum and the minimum value. (c) Representative images of tumors are shown. (B) Western blot analysis of apoptotic cleaved caspases and PARP in PGC1α knocked-down tumors treated with piperlongumine. (C) Body weight measured at the end of experiment. The whiskers in the box plots represent the maximum and the minimum value.

Comment in

Similar articles

Cited by

References

    1. Barretina J, Caponigro G, Stransky N, Venkatesan K, Margolin AA, Kim S, Wilson CJ, Lehar J, Kryukov GV, Sonkin D, et al. The Cancer Cell Line Encyclopedia enables predictive modelling of anticancer drug sensitivity. Nature. 2012;483:603–607. - PMC - PubMed
    1. Bertolotto C, Lesueur F, Giuliano S, Strub T, de Lichy M, Bille K, Dessen P, d'Hayer B, Mohamdi H, Remenieras A, et al. A SUMOylation-defective MITF germline mutation predisposes to melanoma and renal carcinoma. Nature. 2011;480:94–98. - PubMed
    1. Bogunovic D, O'Neill DW, Belitskaya-Levy I, Vacic V, Yu YL, Adams S, Darvishian F, Berman R, Shapiro R, Pavlick AC, et al. Immune profile and mitotic index of metastatic melanoma lesions enhance clinical staging in predicting patient survival. Proceedings of the National Academy of Sciences of the United States of America. 2009;106:20429–20434. - PMC - PubMed
    1. Chang CY, Kazmin D, Jasper JS, Kunder R, Zuercher WJ, McDonnell DP. The Metabolic Regulator ERRalpha, a Downstream Target of HER2/IGF-1R, as a Therapeutic Target in Breast Cancer. Cancer cell. 2011;20:500–510. - PMC - PubMed
    1. Choo AY, Kim SG, Vander Heiden MG, Mahoney SJ, Vu H, Yoon SO, Cantley LC, Blenis J. Glucose addiction of TSC null cells is caused by failed mTORC1-dependent balancing of metabolic demand with supply. Molecular cell. 2010;38:487–499. - PMC - PubMed

Publication types

MeSH terms

Substances

Associated data