. 2013 Feb 21;3(2):291-300.
doi: 10.1016/j.celrep.2013.01.011. Epub 2013 Feb 9.

Dynamics of 5-hydroxymethylcytosine and chromatin marks in Mammalian neurogenesis

Affiliations

Dynamics of 5-hydroxymethylcytosine and chromatin marks in Mammalian neurogenesis

Maria A Hahn et al. Cell Rep. .

Abstract

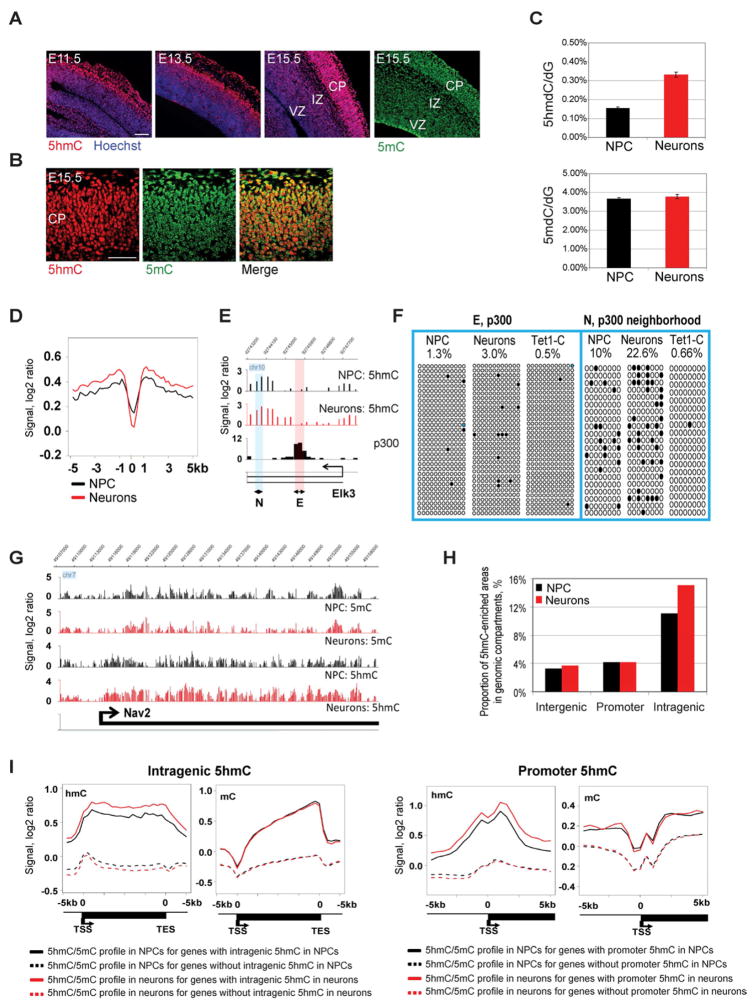
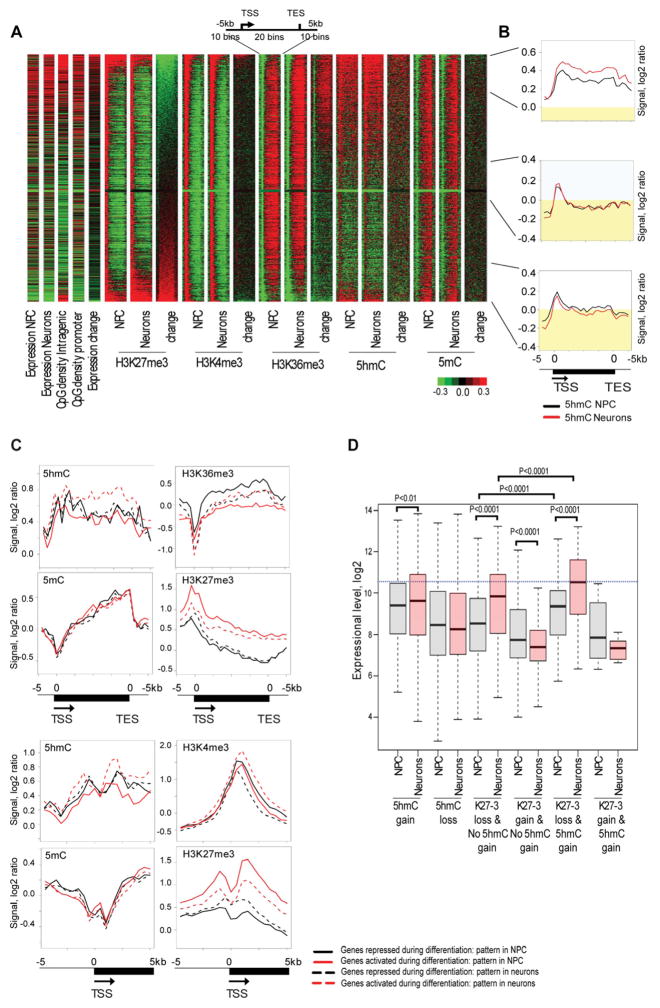
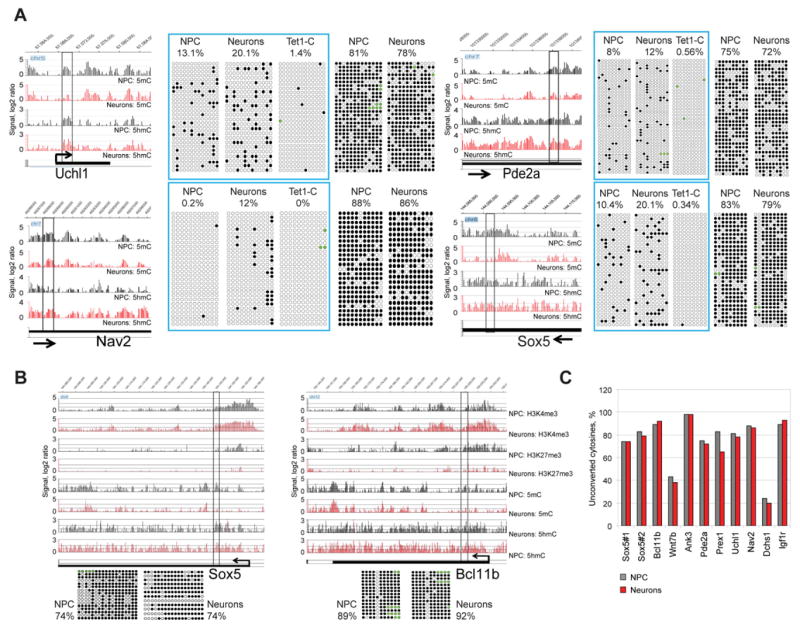
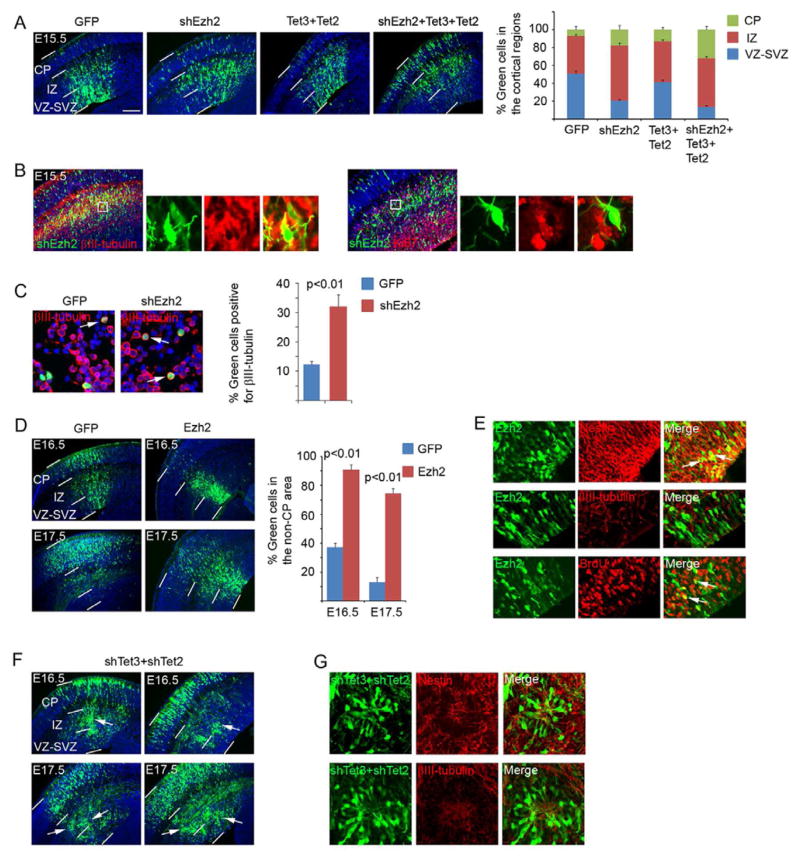
DNA methylation in mammals is highly dynamic during germ cell and preimplantation development but is relatively static during the development of somatic tissues. 5-hydroxymethylcytosine (5hmC), created by oxidation of 5-methylcytosine (5mC) by Tet proteins and most abundant in the brain, is thought to be an intermediary toward 5mC demethylation. We investigated patterns of 5mC and 5hmC during neurogenesis in the embryonic mouse brain. 5hmC levels increase during neuronal differentiation. In neuronal cells, 5hmC is not enriched at enhancers but associates preferentially with gene bodies of activated neuronal function-related genes. Within these genes, gain of 5hmC is often accompanied by loss of H3K27me3. Enrichment of 5hmC is not associated with substantial DNA demethylation, suggesting that 5hmC is a stable epigenetic mark. Functional perturbation of the H3K27 methyltransferase Ezh2 or of Tet2 and Tet3 leads to defects in neuronal differentiation, suggesting that formation of 5hmC and loss of H3K27me3 cooperate to promote brain development.


Figures

Figure 1
Figure 1. Global changes of 5hmC during neuronal differentiation
A. Immunohistochemistry staining of mouse brain from the start of neurogenesis (E11.5) to a peak stage of neurogenesis (E15.5) with anti-5hmC or anti-5mC antibody. 5hmC level in the cortex increases with neuronal differentiation, whereas 5mC level shows little change. VZ, ventricular zone; IZ, intermediate zone; CP, cortical plate; Scale bars indicate 100 μm. B. Co-staining of E15.5 mouse brain with anti-5hmC and anti-5mC antibodies. CP, cortical plate. Scale bars indicate 100 μm. C. LC-MS/MS quantification of 5hmdC and 5mdC in neural progenitor cells and neurons. Levels of 5mdC and 5hmdC are represented relative to dG levels in each cell type. D. 5hmC is depleted at enhancers (p300 sites) genome-wide. The composite profiles of 5hmC at p300 sites and their flanking areas from −5 kb to +5 kb are shown. The location of p300 sites was previously determined in mouse embryonic forebrain (Visel et al., 2009). E. Representative snapshot of missing 5hmC at a p300 binding site in the Elk3 gene. The locations of regions E and N analyzed by TAB sequencing are indicated. F. TAB sequencing of the intragenic Elk3 p300 binding site and flanking region in NPCs, neurons and non-glycosylated control with DNA from neurons (Tet1-C). The percentage of unconverted cytosines (5hmC) after TAB sequencing is indicated. Black circles represent hydroxymethylated CpGs; open circles represent unmethylated CpGs. CpGs with undefined methylation status were marked with blue color. G. Snapshots of 5hmC and 5mC profiles in NPC and differentiating neurons in a representative genomic region encompassing the neuronal differentiation gene Nav2. H. Proportion of 5hmC-enriched areas in genomic compartments during neuronal differentiation. The percentage of 5hmC-covered areas in genomic compartments was determined as the total length of 5hmC-enriched sequences in the compartment divided by the total length of the compartment. I. Composite profiles of 5hmC and 5mC patterns in genes characterized by 5hmC enrichment or lack of 5hmC enrichment in gene body and in promoter regions. 5-hmC-enriched genes were identified by a sliding window approach (see Methods). The black solid lines indicate average levels of 5hmC or 5mC in NPCs for genes with 5hmC enrichment detected in NPCs. The black dotted lines show average levels of 5hmC or 5mC in NPCs for genes without 5hmC enrichment in NPCs. The red solid lines reflect average levels of 5hmC or 5mC in neurons for genes with 5hmC enrichment in neurons. The red dotted lines show average levels of 5hmC or 5mC in neurons for genes without 5hmC enrichment in neurons.
Figure 2
Figure 2. Gain of intragenic 5hmC is associated with loss of H3K27me3 during neuronal differentiation
A. Heatmap analysis of 5mC, 5hmC and histone methylation marks. The heat-map for chromatin modifications and their changes during neuronal differentiation was generated for genes larger than 2 kb and represents a region containing the gene body and the surrounding area (−5 kb to [gene body] to +5 kb). The heat-map contains information about expression in NPCs, expression in neurons, intragenic CpG density, promoter CpG density, expression changes during neuronal differentiation, histone modifications, 5hmC and 5mC patterns for the analyzed cell type and changes of these epigenetic marks during neuronal differentiation (neurons versus NPC). All analyzed genes were sorted by intragenic H3K27me3 changes. Green color indicates a low level or loss, black represents no change and red specifies an increase or high level of a mark. The top 15% of genes with the greatest loss of intragenic H3K27me3, 15% of genes with an intermediate state of H3K27me3 changes and top 15% of the genes with highest gain of intragenic H3K27me3 during neuronal differentiation are indicated on the right. B. Composite profiles of the 5hmC mark in the top 15% of genes with greatest loss of intragenic H3K27me3, 15% of genes with intermediate state of H3K27me3 changes and top 15% of the genes with highest gain of intragenic H3K27me3 during neuronal differentiation (from top to bottom). The black line indicates 5hmC levels in undifferentiated cells and red color represents 5hmC in neurons. Yellow indicates 5hmC signal below zero. C. Epigenetic changes associated with differential expression of genes marked by 5hmC. This analysis was done for genes, which have 5hmC enrichment in the gene body and/or promoters and belong to the top 25% activated or top 25% repressed genes during neuronal differentiation. Composite profiles were generated for promoter regions (−5 kb to TSS to +5 kb) and entire genes (−5 kb to TSS to gene body to TES plus 5 kb). Red solid lines indicate the status of epigenetic marks in NPCs for genes, which are activated during neuronal differentiation. Red dotted lines reflect the status of epigenetic marks in neurons for genes, which are activated during differentiation. Black solid lines indicate the status of epigenetic marks in NPCs for genes, which are repressed during differentiation. Black dotted lines reflect the status of epigentic marks in neurons for genes, which are repressed during differentiation. D. Gain of intragenic 5hmC and loss of H3K27me3 characterizes genes activated during neuronal differentiation. Gene expression levels in NPCs and in neurons were plotted for six groups of genes: genes which gained intragenic 5hmC during neuronal differentiation, genes which lost intragenic 5hmC, genes which lost H3K27me3 at the TSS and its adjacent intragenic region (−0.5 kb<TSS<4.5 kb) and did not gain 5hmC, genes which gained H3K27me3 at the TSS and its adjacent intragenic region and did not gain intragenic 5hmC, genes which gained intragenic 5hmC and lost H3K27me3 at the TSS and its adjacent intragenic region and genes which gained intragenic 5hmC with simultaneous gain of H3K27me3 at promoters. P-values for significant differences between groups (t-test) are shown.
Figure 3
Figure 3. 5hmC gain is not linked to DNA demethylation
A. Detection of 5hmC changes and changes of unmodified cytosines during neuronal differentiation by single-base resolution analysis. Four intragenic regions were analyzed by TAB sequencing and regular bisulfite sequencing in NPCs and neurons. Snapshots indicate patterns of 5hmC and 5mC in NPCs and neurons in the analyzed regions and surrounding areas. The analyzed regions and percentage of unconverted cytosines after TAB sequencing and bisulfite sequencing are shown. TAB data for specific 5hmC sites are framed and contain a control of 5mC/5hmC conversion by Tet1 (Tet1-C). Tet1-C is unglycosylated DNA from neurons after TAB sequencing. Black circles represent methylated or hydroxymethylated CpGs; open circles represent unmethylated CpGs. CpGs with undefined methylation status were marked with green color. B. Bisulfite sequencing analysis of two DNA regions located in the Sox5 and Bcl11b genes, which become activated during neuronal differentiation. Snapshots indicate changes of epigenetic profiles associated with gene activation. The analyzed regions and percentage of unconverted cytosines after bisulfite sequencing are indicated. Black circles represent methylated or hydroxymethylated CpGs; open circles represent unmethylated CpGs. CpGs with undefined methylation status were marked with green color. C. Summary of bisulfite sequencing for 11 DNA regions in NPCs and neurons. For each gene, the percentage of unconverted cytosines (5mC and 5hmC) is indicated.
Figure 4
Figure 4. Functional analyses of Ezh2, Tet2 and Tet3 in the embryonic cortex
A. DNA plasmids (shEzh2, Tet2 and Tet3 cDNAs; all carry an ubiquitin promoter-GFP expression cassette for visualization of the transfected cells) were introduced into the cortex at E13.5 via in utero electroporation. The brains were collected at E15.5 for analysis. Distributions (percentage) of transfected cells in different radial regions of the cortex were scored. Scale bar indicates 100 μm. CP, cortical plate; IZ, intermediate zone; VZ-SVZ, ventricular-subventricular zone. B. Immunostaining of the brains electroporated with shEzh2 for βIII-tubulin or Ki67 expression. C. Cortical cells derived from E15.5 brains (electroporated at E13.5) were plated on poly-D-lysine-coated coverslips for 2 hours, fixed, and stained for βIII-tubulin. Arrows indicate examples of positive cells. Percentage of βIII-tubulin positive green cells was scored. D. Expression plasmids carrying Ezh2 cDNA were electroporated at E13.5 and the transfected brains were analyzed at E16.5 and E17.5. Percentage of cells remaining in the non-CP area (including the IZ and VZ) was scored. E. Immunostaining of the brains electroporated with Ezh2 for nestin, β 3III-tubulin and incorporated BrdU with a 30 min pulse labeling. F. shRNAs of Tet3 and Tet2 were co-electroporated at E13.5 and the transfected brains were analyzed at E16.5 and E17.5. White arrows indicate the clusters of cells in the cortex. G. Immunostaining of the brains electroporated with shRNAs of Tet3 and Tet2 for nestin or βIII-tubulin.

Similar articles

Cited by

References

    1. Bernstein BE, Meissner A, Lander ES. The mammalian epigenome. Cell. 2007;128:669–681. - PubMed
    1. Gu TP, Guo F, Yang H, Wu HP, Xu GF, Liu W, Xie ZG, Shi L, He X, Jin SG, et al. The role of Tet3 DNA dioxygenase in epigenetic reprogramming by oocytes. Nature. 2011;477:606–610. - PubMed
    1. Guo JU, Su Y, Zhong C, Ming GL, Song H. Hydroxylation of 5-methylcytosine by TET1 promotes active DNA demethylation in the adult brain. Cell. 2011;145:423–434. - PMC - PubMed
    1. Hahn MA, Hahn T, Lee DH, Esworthy RS, Kim BW, Riggs AD, Chu FF, Pfeifer GP. Methylation of polycomb target genes in intestinal cancer is mediated by inflammation. Cancer Res. 2008;68:10280–10289. - PMC - PubMed
    1. Huang Y, Pastor WA, Shen Y, Tahiliani M, Liu DR, Rao A. The behaviour of 5-hydroxymethylcytosine in bisulfite sequencing. PLoS One. 2010;5:e8888. - PMC - PubMed

Publication types

MeSH terms

Associated data