. 2013 Apr;14(4):404-12.
doi: 10.1038/ni.2536. Epub 2013 Feb 10.

Transcriptional insights into the CD8(+) T cell response to infection and memory T cell formation

Collaborators, Affiliations

Transcriptional insights into the CD8(+) T cell response to infection and memory T cell formation

J Adam Best et al. Nat Immunol. 2013 Apr.

Abstract

After infection, many factors coordinate the population expansion and differentiation of CD8+ effector and memory T cells. Using data of unparalleled breadth from the Immunological Genome Project, we analyzed the CD8+ T cell transcriptome throughout infection to establish gene-expression signatures and identify putative transcriptional regulators. Notably, we found that the expression of key gene signatures can be used to predict the memory-precursor potential of CD8+ effector cells. Long-lived memory CD8+ cells ultimately expressed a small subset of genes shared by natural killer T and γδ T cells. Although distinct inflammatory milieu and T cell precursor frequencies influenced the differentiation of CD8+ effector and memory populations, core transcriptional signatures were regulated similarly, whether polyclonal or transgenic, and whether responding to bacterial or viral model pathogens. Our results provide insights into the transcriptional regulation that influence memory formation and CD8+ T cell immunity.


Conflict of interest statement

COMPETING FINANCIAL INTERESTS

The authors declare no competing financial interests.

Figures

Figure 1
Figure 1
Gene-expression profiles associated with the activation and memory formation of CD8+ T cells. (a) Quantification of genes upregulated (Up) or downregulated (Down) in infection-exposed OT-I cells relative to their expression in naive OT-I cells at various time points during infection (horizontal axis). (b) Hierarchical clustering analysis of OT-I cells sorted at various time points after infection with Lm-OVA, filtered for a change in expression of over twofold anywhere in the data set, a coefficient of variation of less than 0.5 and mean expression value of over 120. (c) Ten clusters with the most dynamic expression by K-means clustering analysis, filtered as in b but with a change in expression of over 1.4-fold. Each line represents a single probe; numbers in bottom right corners indicate number of probes; above plots, genes of interest in each cluster. (d) Heat map (bottom) of the correlation coefficients of mean gene expression fit to an artificial exemplar (top) of genes upregulated only at day 45 and day 100 of infection (left) or of genes upregulated only at day 100 (right), showing the top 15% of correlated genes. (e) Quantification of genes in each cluster a given gene ontology (GO) tag related to metabolism (key), presented relative to all genes with that tag. Data are representative of three experiments with a compilation of two (48 h and day 100) or three (all other time points) independent samples sorted from pooled spleens (n ≥ 3 per sample).
Figure 2
Figure 2
Coregulated genes can be used to predict transcriptional regulation of T cell activation. Enrichment for genes in activated CD8+ T cell clusters (identified in Fig. 1) in the context of fine modules of coregulated genes identified by the ImmGen Consortium, for genes encoding selected regulators of T cells (key) predicted through the use of the Ontogenet algorithm based on enriched modules (Supplementary Fig. 4), ‘curated’ by relevance to T cell biology and in order of predicted weight, for which genes with a ‘weight’ of 0 do not contribute to the regulatory program of that cell population.
Figure 3
Figure 3
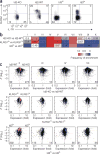
Regulation of core gene-expression modules by memory precursor cells. (a) Flow cytometry of CD8+ T cells from Id2-deficient mice (Id2-KO) and Id2-wild-type mice (Id2-WT) and Id3hi and Id3lo CD8+ T cells, on day 6 of infection with VSV-OVA. Numbers in quadrants indicate percent cells in each. (b) Heat map of the frequency of enrichment of clusters (Fig. 1c) in wild-type and Id2-deficient samples collected on day 6 of infection with Lm-OVA and Id3hi and Id3lo samples collected on day 5 of infection with VSV-OVA (both pre-peak time points) for the following comparisons: Id2-deficient versus wild-type cells (both KLRG1loIL-7Rhi; top), KLRG1loIL-7Rhi cells versus KLRG1hiIL-7Rlo cells (both wild-type; middle), or Id3hi versus Id3lo cells (both CD44+KLRG1loIL-7Rlo; bottom). Numbers in map indicate proportion of cells with enrichment for that comparison; a frequency of 1.0 (red) indicates memory potential, and a frequency of 0.0 (blue) indicates effector potential. *P < 0.05 (χ2 test). (c) ‘Volcano plots’ of the comparison of Id2-deficient KLRG1lo cells versus wild-type KLRG1lo cells (top), wild-type KLRG1lo cells versus wildtype KLRG1hi cells (middle), and Id3hi cells versus Id3lo cells (bottom), showing cluster-specific genes for each comparison. Numbers in bottom right and left corners indicate the number of genes in that region. Data are representative of three independent experiments with three mice per genotype (a) or three experiments with three independent samples from pooled spleens (b,c; n ≥ 3 per sample).
Figure 4
Figure 4
Common gene-expression patterns of transgenic and endogenous CD8+ effector and memory T cells. (a) Difference in gene expression of H-2Kb–OVA tetramer–positive antigen-specific (endogenous) cells (Tet+) versus OT-I cells (OT-I) on day 8 or day 45 of infection with Lm-OVA, for genes identified by K-means clustering analysis (Fig. 1); colors in plots (genes) match colors of clusters (key); blue diagonal lines indicate a difference in expression of twofold. (b) Comparison of gene expression on day 8 versus day 45 after infection as in a for tetramer-positive cells, plotted against that for OT-I CD8+ T cells; colors in plots (genes) match colors of clusters (key); values in key indicate the change in expression (mean yixi) ± s.e.m.; diagonal line indicates y = x. *P < 0.001 and **P < 0.00001 (t-test). Data are representative of two independent experiments with three mice per group.
Figure 5
Figure 5
Regulation of genes associated with activation state is independent of infection. (a) Heat map of all genes upregulated or downregulated more than twofold in pooled effector cells relative to their expression in pooled memory cells during infection with Lm-OVA (LM) or VSV-OVA (VSV) at matching effector or memory time points (above plots). (b) Direct comparison of expression at each time point after infection with Lm-OVA or VSV-OVA; numbers in top left and bottom right corners indicate number of genes with difference in expression of over twofold (blue lines as in Fig. 4a). (c) Change in gene expression after infection with Lm-OVA versus VSV-OVA at pooled effector time points (horizontal axis) versus that at pooled memory time points (vertical axis); red, genes upregulated after infection with Lm-OVA; blue, genes upregulated after infection with VSV-OVA; labels indicate infection-specific genes of interest. (d) Flow cytometry of OT-I CD8+ cells at day 6 of Lm-OVA infection or day 5 of VSV-OVA infection; numbers at top indicate median fluorescent intensity (MFI); numbers above bracketed lines indicate percent CTLA-4+ cells (left) or KLRG1+ cells (right) in gated populations. (e) Comparison of gene expression by pooled effector cells versus pooled memory cells after infection with Lm-OVA (horizontal axis) versus that comparison after infection with VSV-OVA (presented as in Fig. 4b). *P < 0.001 and **P < 0.00001 (t-test). Data are from three independent experiments with three mice (a–c,e) or four mice (d) per group.
Figure 6
Figure 6
Genes induced in CD8+ memory T cells correlate with gene expression by NKT cells and activated γδ T cells. (a) Heat map of the frequency of enrichment for CD8+ T cell gene clusters (Fig. 1c) or memory-specific genes (Fig. 1d) in populations of B cells, NKT cells and γδ T cells. Red and blue (key) indicate cluster comparisons with the highest and lowest frequency of correlation (25%): red, higher frequency (> 0.75); blue, lower frequency (< 0.25). GC, germinal center; foll, follicular; MZ, marginal zone; act, activated; γδ2+, Vγ2+ γδ T cell; γδ2, Vγ2 γδ T cell; mem, memory. *P < 0.05 (χ2 test). (b) Principle-component analysis of various cells (labels in plot and key) for genes defined in Figure 1a. MCMV, mouse cytomegalovirus; thy, thymus; spl, spleen; Tγδ, γδ T cell; IEL, intraepithelial lymphocyte. Data are pooled from three independent experiments with at least three mice per group.

Similar articles

Cited by

References

    1. Heng TS, Painter MW. The Immunological Genome Project: networks of gene expression in immune cells. Nat Immunol. 2008;9:1091–1094. - PubMed
    1. Haining WN, et al. Identification of an evolutionarily conserved transcriptional signature of CD8 memory differentiation that is shared by T and B cells. J Immunol. 2008;181:1859–1868. - PMC - PubMed
    1. Kaech SM, Hemby S, Kersh E, Ahmed R. Molecular and functional profiling of memory CD8 T cell differentiation. Cell. 2002;111:837–851. - PubMed
    1. Sarkar S, et al. Functional and genomic profiling of effector CD8 T cell subsets with distinct memory fates. J Exp Med. 2008;205:625–640. - PMC - PubMed
    1. Wirth TC, et al. Repetitive antigen stimulation induces stepwise transcriptome diversification but preserves a core signature of memory CD8+ T cell differentiation. Immunity. 2010;33:128–140. - PMC - PubMed

Publication types

Substances

Associated data