

Expression of immune genes on chromosome 6p21.3-22.1 in schizophrenia
- PMID: 23395714
- PMCID: PMC3686871
- DOI: 10.1016/j.bbi.2013.01.087
Expression of immune genes on chromosome 6p21.3-22.1 in schizophrenia
Abstract
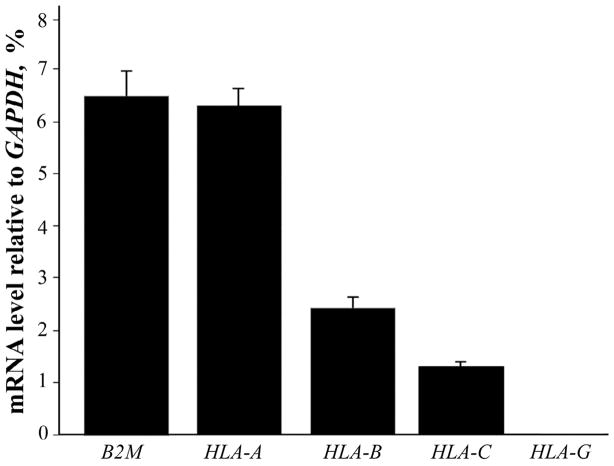
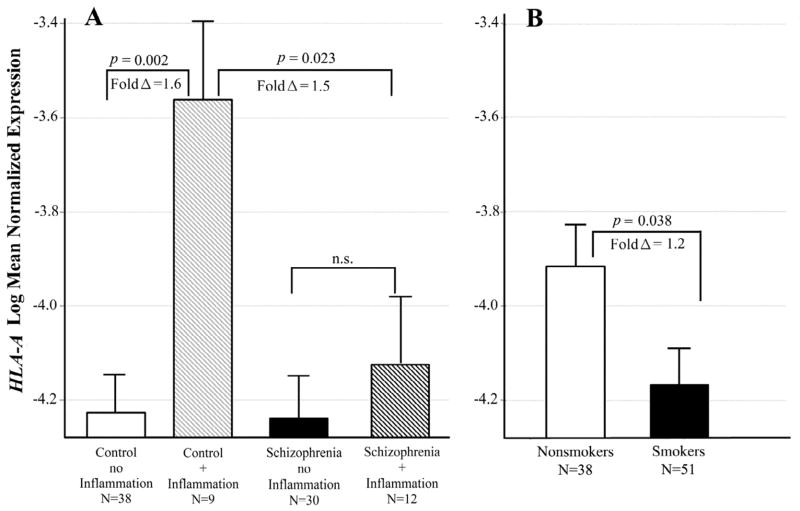
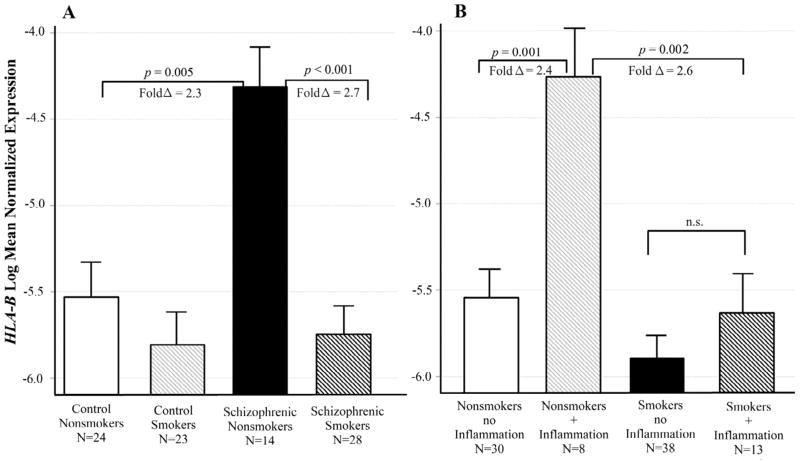
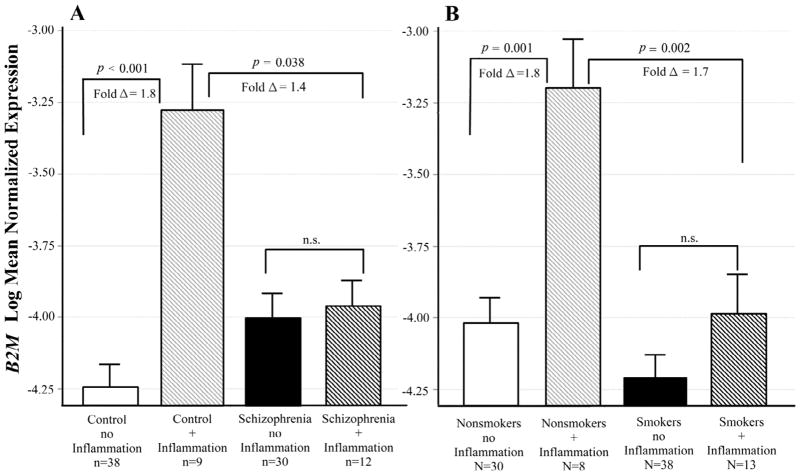
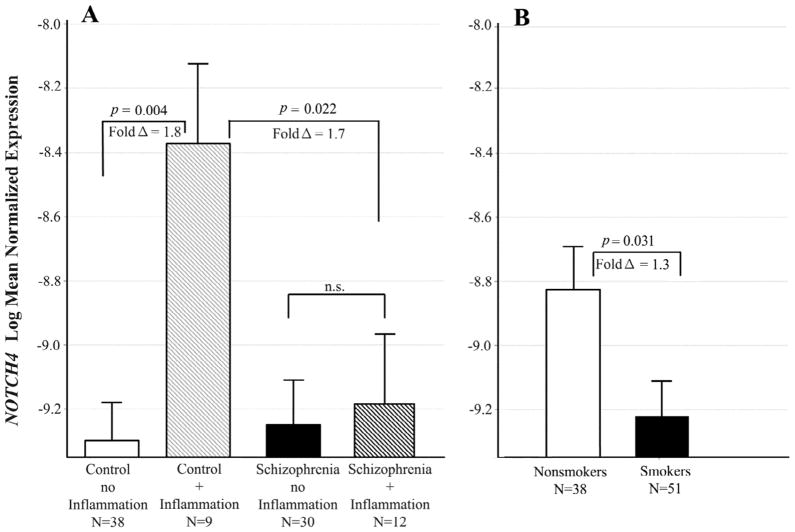
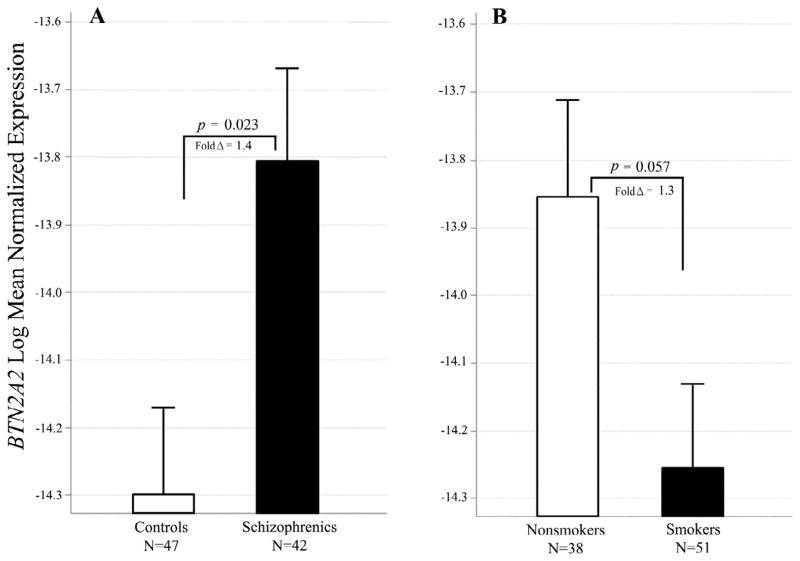
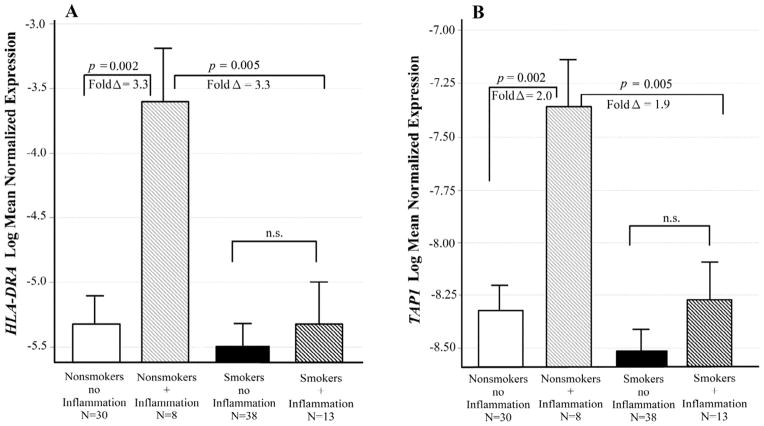
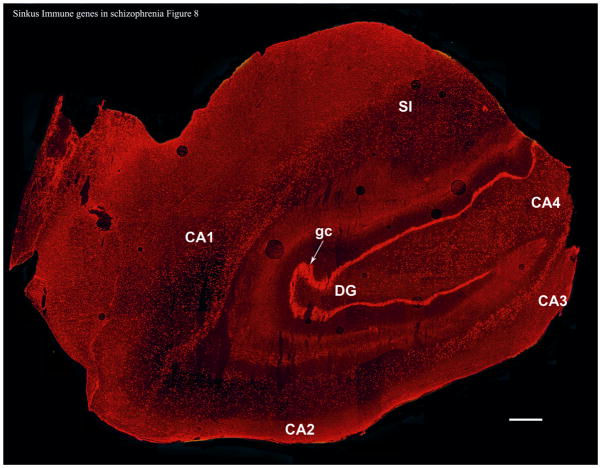
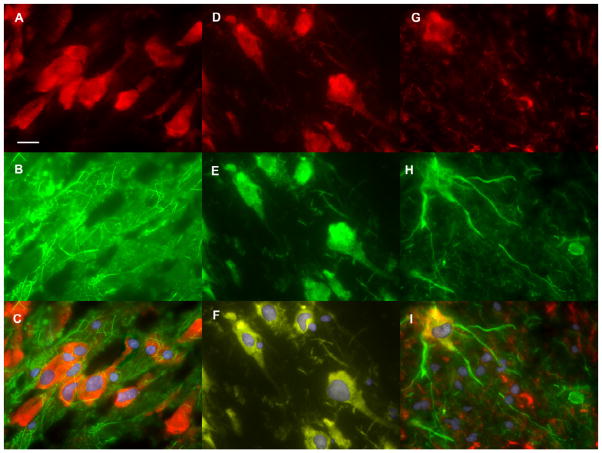
Schizophrenia is a common mental illness with a large genetic component. Three genome-wide association studies have implicated the major histocompatibility complex gene region on chromosome 6p21.3-22.1 in schizophrenia. In addition, nicotine, which is commonly abused in schizophrenia, affects the expression of central nervous system immune genes. Messenger RNA levels for genes in the 6p21.3-22.1 region were measured in human postmortem hippocampus of 89 subjects. The effects of schizophrenia diagnosis, smoking and systemic inflammatory illness were compared. Cell-specific expression patterns for the class I major histocompatibility complex gene HLA-A were explored utilizing in situ hybridization. Expression of five genes was altered in schizophrenic subjects. Messenger RNA levels for the class I major histocompatibility complex antigen HLA-B were increased in schizophrenic nonsmokers, while levels for smokers were indistinguishable from those of controls. β2 microglobulin, HLA-A and Notch4 were all expressed in a pattern where inflammatory illness was associated with increased expression in controls but not in subjects with schizophrenia. Schizophrenia was also associated with increased expression of Butyrophilin 2A2. HLA-A was expressed in glutamatergic and GABAergic neurons in the dentate gyrus, hilus, and the stratum pyramidale of the CA1-CA4 regions of the hippocampus, but not in astrocytes. In conclusion, the expression of genes from the major histocompatibility complex region of chromosome 6 with likely roles in synaptic development is altered in schizophrenia. There were also significant interactions between schizophrenia diagnosis and both inflammatory illness and smoking.
Copyright © 2013 Elsevier Inc. All rights reserved.
Conflict of interest statement
Conflict of interest statement:
All authors declare that there are no conflicts of interest.
Figures
Similar articles
-
Reduced expression of HLA-B35 in schizophrenia.Psychiatr Genet. 1996 Summer;6(2):51-9. doi: 10.1097/00041444-199622000-00004. Psychiatr Genet. 1996. PMID: 8840390
-
Cellular immunity, HLA-class I antigens, and family history of psychiatric disorder in endogenous psychoses.Psychiatry Res. 1993 Sep;48(3):201-17. doi: 10.1016/0165-1781(93)90072-o. Psychiatry Res. 1993. PMID: 8272443
-
Paradoxical downregulation of HLA-A expression by IFNγ associated with schizophrenia and noncoding genes.Immunobiology. 2013 May;218(5):738-44. doi: 10.1016/j.imbio.2012.08.275. Epub 2012 Sep 18. Immunobiology. 2013. PMID: 23083632
-
The multiple roles of major histocompatibility complex class-I-like molecules in mucosal immune function.Acta Odontol Scand. 2001 Jun;59(3):139-44. doi: 10.1080/000163501750266729. Acta Odontol Scand. 2001. PMID: 11501882 Free PMC article. Review.
-
HLA Class I Chromosomal Region, Genes, and Products: Facts and Questions.Crit Rev Immunol. 2017;37(2-6):317-357. doi: 10.1615/CritRevImmunol.v37.i2-6.80. Crit Rev Immunol. 2017. PMID: 29773025 Review.
Cited by
-
Postmortem evidence of cerebral inflammation in schizophrenia: a systematic review.Mol Psychiatry. 2016 Aug;21(8):1009-26. doi: 10.1038/mp.2016.90. Epub 2016 Jun 7. Mol Psychiatry. 2016. PMID: 27271499 Free PMC article. Review.
-
Distinct Phenotypes of Inflammation Associated Macrophages and Microglia in the Prefrontal Cortex Schizophrenia Compared to Controls.Front Neurosci. 2022 Jun 30;16:858989. doi: 10.3389/fnins.2022.858989. eCollection 2022. Front Neurosci. 2022. PMID: 35844224 Free PMC article.
-
Major histocompatibility complex I in brain development and schizophrenia.Biol Psychiatry. 2014 Feb 15;75(4):262-8. doi: 10.1016/j.biopsych.2013.10.003. Epub 2013 Oct 10. Biol Psychiatry. 2014. PMID: 24199663 Free PMC article. Review.
-
MHC class I limits hippocampal synapse density by inhibiting neuronal insulin receptor signaling.J Neurosci. 2014 Aug 27;34(35):11844-56. doi: 10.1523/JNEUROSCI.4642-12.2014. J Neurosci. 2014. PMID: 25164678 Free PMC article.
-
Microvascular anomaly conditions in psychiatric disease. Schizophrenia - angiogenesis connection.Neurosci Biobehav Rev. 2017 Jun;77:327-339. doi: 10.1016/j.neubiorev.2017.04.003. Epub 2017 Apr 8. Neurosci Biobehav Rev. 2017. PMID: 28396239 Free PMC article. Review.
References
-
- Albensi BC, Mattson MP. Evidence for the involvement of TNF and NF-κB in hippocampal synaptic plasticity. Synapse. 2000;35:151–159. - PubMed
-
- Andersen CL, Jensen JL, Ørntoft TF. Normalization of Real-Time Quantitative Reverse Transcription-PCR Data: A Model-Based Variance Estimation Approach to Identify Genes Suited for Normalization, Applied to Bladder and Colon Cancer Data Sets. Cancer Research. 2004;64:5245–5250. - PubMed
-
- Benjamini Y, Hochberg Y. Controlling the false discovery rate - A practical and powerful approach to multiple testing. Journal of the Royal Statistical Society Series B- Methodological. 1995;57:289–300.
-
- Blank T, Prinz M. Microglia as modulators of cognition and neuropsychiatric disorders. Glia. 2012 (ePub ahead of print) - PubMed
-
- Boulanger LM. Immune proteins in brain development and synaptic plasticity. Neuron. 2009;64:93–109. - PubMed
Publication types
MeSH terms
Substances
Grants and funding
LinkOut - more resources
Full Text Sources
Other Literature Sources
Medical
Research Materials
Miscellaneous
