

Mitochondrial reactive oxygen species promote epidermal differentiation and hair follicle development
- PMID: 23386745
- PMCID: PMC4017376
- DOI: 10.1126/scisignal.2003638
Mitochondrial reactive oxygen species promote epidermal differentiation and hair follicle development
Abstract
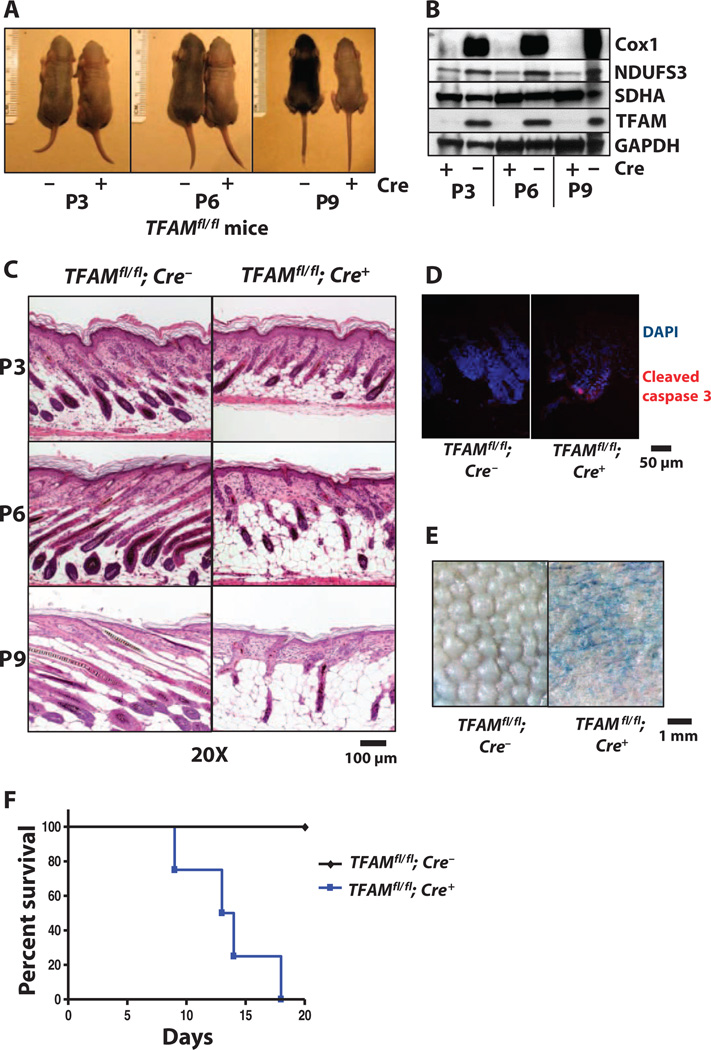
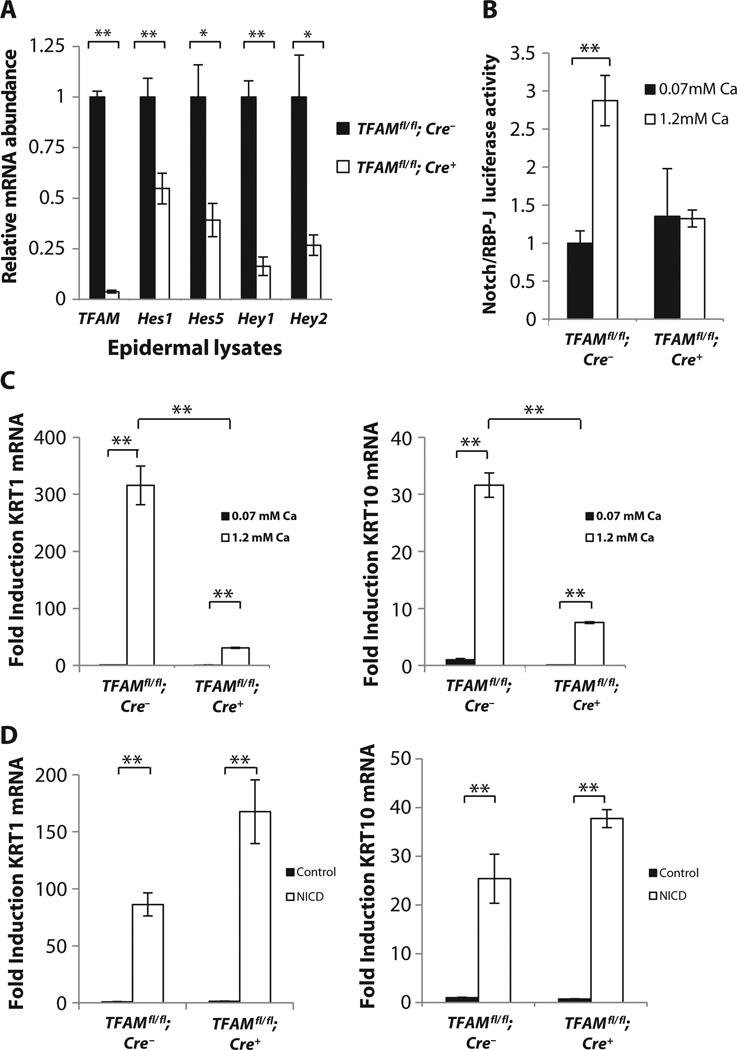
Proper regulation of keratinocyte differentiation within the epidermis and follicular epithelium is essential for maintenance of epidermal barrier function and hair growth. The signaling intermediates that regulate the morphological and genetic changes associated with epidermal and follicular differentiation remain poorly understood. We tested the hypothesis that reactive oxygen species (ROS) generated by mitochondria are an important regulator of epidermal differentiation by generating mice with a keratinocyte-specific deficiency in mitochondrial transcription factor A (TFAM), which is required for the transcription of mitochondrial genes encoding electron transport chain subunits. Ablation of TFAM in keratinocytes impaired epidermal differentiation and hair follicle growth and resulted in death 2 weeks after birth. TFAM-deficient keratinocytes failed to generate mitochondria-derived ROS, a deficiency that prevented the transmission of Notch and β-catenin signals essential for epidermal differentiation and hair follicle development, respectively. In vitro keratinocyte differentiation was inhibited in the presence of antioxidants, and the decreased differentiation marker abundance in TFAM-deficient keratinocytes was partly rescued by application of exogenous hydrogen peroxide. These findings indicate that mitochondria-generated ROS are critical mediators of cellular differentiation and tissue morphogenesis.
Figures


Comment in
-
Development: A good hair day for ROS.Nat Rev Mol Cell Biol. 2013 Apr;14(4):194-5. doi: 10.1038/nrm3547. Epub 2013 Mar 6. Nat Rev Mol Cell Biol. 2013. PMID: 23463218 No abstract available.
-
Development: a good hair day for ROS.Nat Rev Mol Cell Biol. 2013 Apr;14(4):194-5. Nat Rev Mol Cell Biol. 2013. PMID: 23847777 No abstract available.
Similar articles
-
Jagged 1 is a beta-catenin target gene required for ectopic hair follicle formation in adult epidermis.Development. 2006 Nov;133(22):4427-38. doi: 10.1242/dev.02644. Epub 2006 Oct 11. Development. 2006. PMID: 17035290
-
Coactivator MED1 ablation in keratinocytes results in hair-cycling defects and epidermal alterations.J Invest Dermatol. 2012 Apr;132(4):1075-83. doi: 10.1038/jid.2011.430. Epub 2011 Dec 22. J Invest Dermatol. 2012. PMID: 22189783 Free PMC article.
-
The mitochondrial electron transport chain is dispensable for proliferation and differentiation of epidermal progenitor cells.Stem Cells. 2011 Sep;29(9):1459-68. doi: 10.1002/stem.695. Stem Cells. 2011. PMID: 21780252
-
Notch signaling and the developing hair follicle.Adv Exp Med Biol. 2012;727:142-60. doi: 10.1007/978-1-4614-0899-4_11. Adv Exp Med Biol. 2012. PMID: 22399345 Review.
-
Advances in resolving the heterogeneity and dynamics of keratinocyte differentiation.Curr Opin Cell Biol. 2020 Dec;67:92-98. doi: 10.1016/j.ceb.2020.09.004. Epub 2020 Oct 19. Curr Opin Cell Biol. 2020. PMID: 33091828 Free PMC article. Review.
Cited by
-
Photoactivation of ROS Production In Situ Transiently Activates Cell Proliferation in Mouse Skin and in the Hair Follicle Stem Cell Niche Promoting Hair Growth and Wound Healing.J Invest Dermatol. 2015 Nov;135(11):2611-2622. doi: 10.1038/jid.2015.248. Epub 2015 Jul 2. J Invest Dermatol. 2015. PMID: 26134949 Free PMC article.
-
Asbestos-induced alveolar epithelial cell apoptosis. The role of endoplasmic reticulum stress response.Am J Respir Cell Mol Biol. 2013 Dec;49(6):892-901. doi: 10.1165/rcmb.2013-0053OC. Am J Respir Cell Mol Biol. 2013. PMID: 23885834 Free PMC article.
-
Sestrins as a Therapeutic Bridge between ROS and Autophagy in Cancer.Cancers (Basel). 2019 Sep 22;11(10):1415. doi: 10.3390/cancers11101415. Cancers (Basel). 2019. PMID: 31546746 Free PMC article. Review.
-
Hif-1a suppresses ROS-induced proliferation of cardiac fibroblasts following myocardial infarction.Cell Stem Cell. 2022 Feb 3;29(2):281-297.e12. doi: 10.1016/j.stem.2021.10.009. Epub 2021 Nov 10. Cell Stem Cell. 2022. PMID: 34762860 Free PMC article.
-
Suppressing Mitochondrial Respiration Is Critical for Hypoxia Tolerance in the Fetal Growth Plate.Dev Cell. 2019 Jun 3;49(5):748-763.e7. doi: 10.1016/j.devcel.2019.04.029. Epub 2019 May 16. Dev Cell. 2019. PMID: 31105007 Free PMC article.
References
-
- Senoo M, Pinto F, Crum CP, McKeon F. p63 is essential for the proliferative potential of stem cells in stratified epithelia. Cell. 2007;129:523–536. - PubMed
Publication types
MeSH terms
Substances
Grants and funding
- R01 CA157996/CA/NCI NIH HHS/United States
- EY 06769/EY/NEI NIH HHS/United States
- R01 GM076561/GM/NIGMS NIH HHS/United States
- EY017536/EY/NEI NIH HHS/United States
- F32 HL099007/HL/NHLBI NIH HHS/United States
- R01 AR062110/AR/NIAMS NIH HHS/United States
- R21 EY017536/EY/NEI NIH HHS/United States
- R01 EY006769/EY/NEI NIH HHS/United States
- R01 EY019463/EY/NEI NIH HHS/United States
- AR057216/AR/NIAMS NIH HHS/United States
- F32 EY006769/EY/NEI NIH HHS/United States
- R21 AR061174/AR/NIAMS NIH HHS/United States
- P30 AR057216/AR/NIAMS NIH HHS/United States
- 5R21AR061174-02/AR/NIAMS NIH HHS/United States
- 1F32HL099007-01/HL/NHLBI NIH HHS/United States
- EY019463/EY/NEI NIH HHS/United States
LinkOut - more resources
Full Text Sources
Other Literature Sources
Molecular Biology Databases
Research Materials
