Increased level of myeloid-derived suppressor cells, programmed death receptor ligand 1/programmed death receptor 1, and soluble CD25 in Sokal high risk chronic myeloid leukemia
- PMID: 23383287
- PMCID: PMC3561335
- DOI: 10.1371/journal.pone.0055818
Increased level of myeloid-derived suppressor cells, programmed death receptor ligand 1/programmed death receptor 1, and soluble CD25 in Sokal high risk chronic myeloid leukemia
Abstract
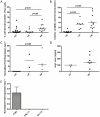
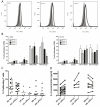
Immunotherapy (eg interferon α) in combination with tyrosine kinase inhibitors is currently in clinical trials for treatment of chronic myeloid leukemia (CML). Cancer patients commonly have problems with so called immune escape mechanisms that may hamper immunotherapy. Hence, to study the function of the immune system in CML is of interest. In the present paper we have identified immune escape mechanisms in CML with focus on those that directly hamper T cells since these cells are important to control tumor progression. CML patient samples were investigated for the presence of myeloid-derived suppressor cells (MDSCs), expression of programmed death receptor ligand 1/programmed death receptor 1 (PD-L1/PD-1), arginase 1 and soluble CD25. MDSC levels were increased in samples from Sokal high risk patients (p<0.05) and the cells were present on both CD34 negative and CD34 positive cell populations. Furthermore, expression of the MDSC-associated molecule arginase 1, known to inhibit T cells, was increased in the patients (p = 0.0079). Myeloid cells upregulated PD-L1 (p<0.05) and the receptor PD-1 was present on T cells. However, PD-L1 blockade did not increase T cell proliferation but upregulated IL-2 secretion. Finally, soluble CD25 was increased in high risk patients (p<0.0001). In conclusion T cells in CML patients may be under the control of different immune escape mechanisms that could hamper the use of immunotherapy in these patients. These escape mechanisms should be monitored in trials to understand their importance and how to overcome the immune suppression.
Conflict of interest statement
Figures


Similar articles
-
Activated T cells sustain myeloid-derived suppressor cell-mediated immune suppression.Oncotarget. 2016 Jan 12;7(2):1168-84. doi: 10.18632/oncotarget.6662. Oncotarget. 2016. PMID: 26700461 Free PMC article.
-
α-Galactosylceramide but not phenyl-glycolipids induced NKT cell anergy and IL-33-mediated myeloid-derived suppressor cell accumulation via upregulation of egr2/3.J Immunol. 2014 Feb 15;192(4):1972-81. doi: 10.4049/jimmunol.1302623. Epub 2014 Jan 24. J Immunol. 2014. PMID: 24465013
-
PD-L1 is a novel direct target of HIF-1α, and its blockade under hypoxia enhanced MDSC-mediated T cell activation.J Exp Med. 2014 May 5;211(5):781-90. doi: 10.1084/jem.20131916. Epub 2014 Apr 28. J Exp Med. 2014. PMID: 24778419 Free PMC article.
-
Programmed cell death-1 pathway inhibition in myeloid malignancies: implications for myeloproliferative neoplasms.Ann Hematol. 2017 Jun;96(6):919-927. doi: 10.1007/s00277-016-2915-4. Epub 2017 Jan 6. Ann Hematol. 2017. PMID: 28062906 Review.
-
Osteoclast Immunosuppressive Effects in Multiple Myeloma: Role of Programmed Cell Death Ligand 1.Front Immunol. 2018 Aug 10;9:1822. doi: 10.3389/fimmu.2018.01822. eCollection 2018. Front Immunol. 2018. PMID: 30147691 Free PMC article. Review.
Cited by
-
Immune checkpoint blockade in human cancer therapy: lung cancer and hematologic malignancies.Immunotherapy. 2016 Jun;8(7):809-19. doi: 10.2217/imt-2016-0001. Immunotherapy. 2016. PMID: 27349980 Free PMC article. Review.
-
A new hope in immunotherapy for malignant gliomas: adoptive T cell transfer therapy.J Immunol Res. 2014;2014:326545. doi: 10.1155/2014/326545. Epub 2014 Jun 9. J Immunol Res. 2014. PMID: 25009822 Free PMC article. Review.
-
DC generation from peripheral blood mononuclear cells in patients with chronic myeloid leukemia: Influence of interferons on DC yield and functional properties.Hum Vaccin Immunother. 2016 May 3;12(5):1117-23. doi: 10.1080/21645515.2015.1132965. Epub 2016 Feb 10. Hum Vaccin Immunother. 2016. PMID: 26864050 Free PMC article.
-
The hOCT1 and ABCB1 polymorphisms do not influence the pharmacodynamics of nilotinib in chronic myeloid leukemia.Oncotarget. 2017 Sep 30;8(50):88021-88033. doi: 10.18632/oncotarget.21406. eCollection 2017 Oct 20. Oncotarget. 2017. PMID: 29152138 Free PMC article.
-
Differences in PD-1 expression on CD8+ T-cells in chronic myeloid leukemia patients according to disease phase and TKI medication.Cancer Immunol Immunother. 2020 Nov;69(11):2223-2232. doi: 10.1007/s00262-020-02617-5. Epub 2020 May 30. Cancer Immunol Immunother. 2020. PMID: 32474769 Free PMC article.
References
-
- Rowley JD (1973) Letter: A new consistent chromosomal abnormality in chronic myelogenous leukaemia identified by quinacrine fluorescence and Giemsa staining. Nature 243: 290–293. - PubMed
-
- Sokal JE, Cox EB, Baccarani M, Tura S, Gomez GA, et al. (1984) Prognostic discrimination in “good-risk” chronic granulocytic leukemia. Blood 63: 789–799. - PubMed
-
- Hochhaus A, O'Brien SG, Guilhot F, Druker BJ, Branford S, et al. (2009) Six-year follow-up of patients receiving imatinib for the first-line treatment of chronic myeloid leukemia. Leukemia 23: 1054–1061. - PubMed
-
- Horowitz MM, Gale RP, Sondel PM, Goldman JM, Kersey J, et al. (1990) Graft-versus-leukemia reactions after bone marrow transplantation. Blood 75: 555–562. - PubMed
-
- Or R, Shapira MY, Resnick I, Amar A, Ackerstein A, et al. (2003) Nonmyeloablative allogeneic stem cell transplantation for the treatment of chronic myeloid leukemia in first chronic phase. Blood 101: 441–445. - PubMed
Publication types
MeSH terms
Substances
Grants and funding
LinkOut - more resources
Full Text Sources
Other Literature Sources
Medical
Research Materials
Miscellaneous

