

Gamna-Gandy bodies of the spleen detected with susceptibility weighted imaging: maybe a new potential non-invasive marker of esophageal varices
- PMID: 23383250
- PMCID: PMC3561306
- DOI: 10.1371/journal.pone.0055626
Gamna-Gandy bodies of the spleen detected with susceptibility weighted imaging: maybe a new potential non-invasive marker of esophageal varices
Abstract
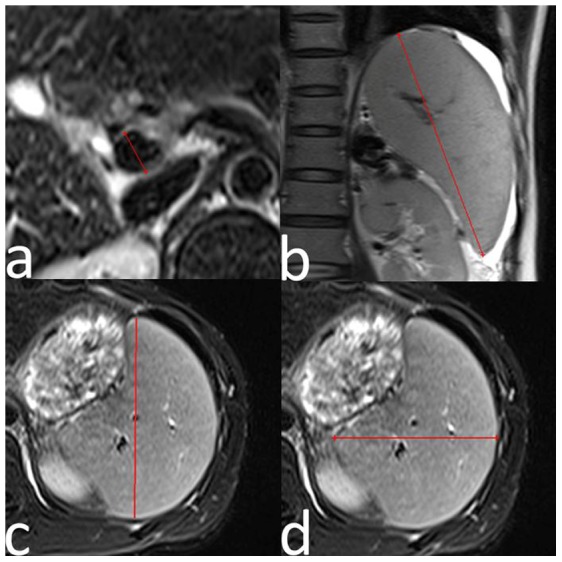
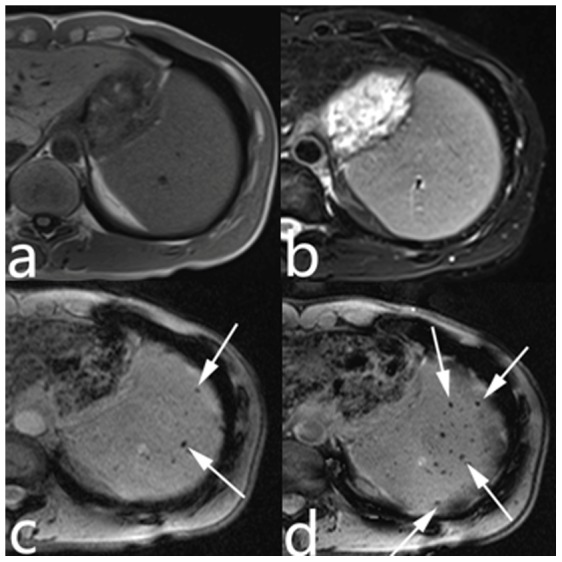
Background/objectives: Portal hypertension (PH) is a clinical sequelae of liver cirrhosis, and bleeding from esophageal varices (EV) is a serious complication of PH with significant morbidity and mortality. The aims of this study were to assess the ability of 2D multislice breath-hold susceptibility weighted imaging (SWI) to detect Gamna-Gandy bodies (GGBs) in the spleens of patients with PH and to evaluate the potential role of GGB number as a non-invasive marker of PH and EV.
Materials and methods: T1-, T2- and T2(*)-weighted imaging and SWI were performed on 135 patients with PH and on 37 control individuals. Platelet counts were collected from all PH patients. Two radiologists analyzed all magnetic resonance imaging (MRI) data, and measured the portal vein diameter, splenic index (SI), and platelet count/spleen diameter ratio. The numbers of patients with GGBs in the spleen were determined, and the numbers of GGB were counted in the four MRI sequences in GGB-positive patients. The portal vein diameter, SI, platelet count, and platelet count/spleen diameter ratio of control individuals were compared with those of GGB-negative and GGB-positive patients on SWI images. The correlations among GGB numbers, the portal vein diameter, the SI, the platelet count, and the platelet count/spleen diameter ratio were analyzed.
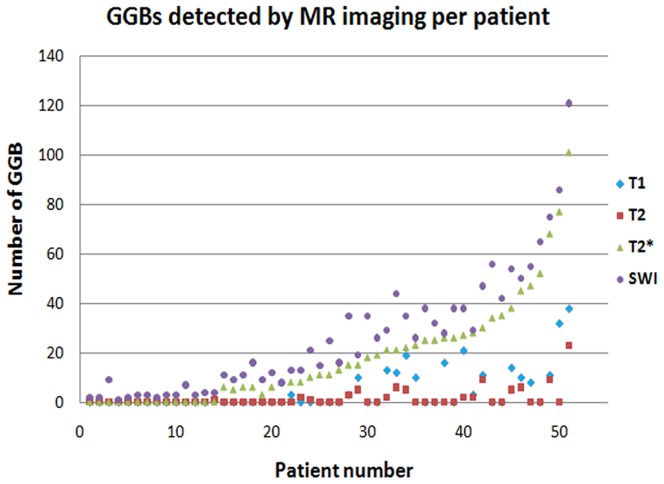
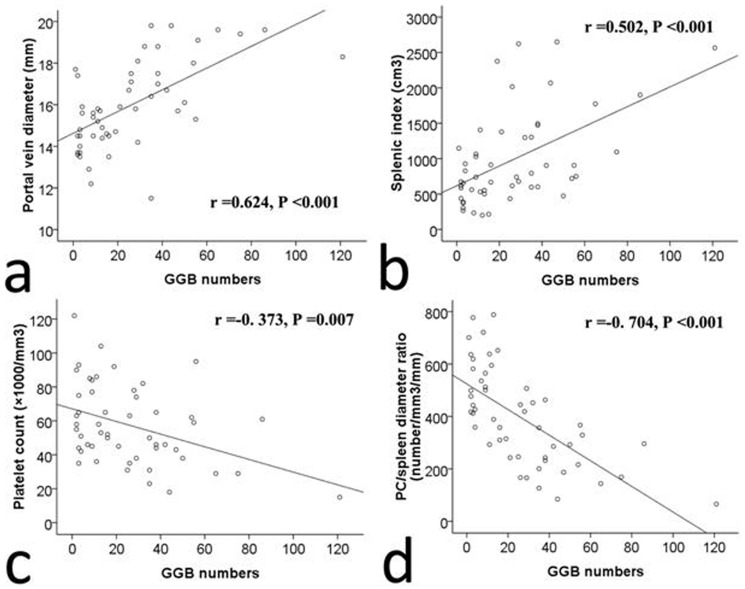
Results: The GGB detection rate and the detected GGB number by using SWI were significantly greater than those by using T1-, T2-, and T2*-weighted images. The number of GGBs in the SWI images correlated positively with the portal vein diameter and SI and correlated negatively with the platelet count and platelet count/spleen diameter ratio.
Conclusion: SWI provided more accurate information of GGBs in patients with PH. The number of GGB may be a non-invasive predictor of improving the selection for endoscopic screening of PH patients at risk of EV.
Conflict of interest statement
Figures

Similar articles
-
Evaluation of the splenic vein diameter and longitudinal size of the spleen in patients with Gamna-Gandy bodies.Diagn Interv Radiol. 2006 Sep;12(3):125-8. Diagn Interv Radiol. 2006. PMID: 16972216
-
Elastography, spleen size, and platelet count identify portal hypertension in patients with compensated cirrhosis.Gastroenterology. 2013 Jan;144(1):102-111.e1. doi: 10.1053/j.gastro.2012.10.001. Epub 2012 Oct 8. Gastroenterology. 2013. PMID: 23058320
-
Platelet count to splenic diameter ratio and other noninvasive markers as predictors of esophageal varices in patients with liver cirrhosis.Turk J Gastroenterol. 2017 Sep;28(5):347-352. doi: 10.5152/tjg.2017.17090. Epub 2017 Aug 4. Turk J Gastroenterol. 2017. PMID: 28776495
-
[Non-invasive diagnosis of portal hypertension in cirrhosis. Application to the primary prevention of varices].Gastroenterol Clin Biol. 2005 Oct;29(10):975-87. doi: 10.1016/s0399-8320(05)88170-9. Gastroenterol Clin Biol. 2005. PMID: 16435503 Review. French.
-
Performance of platelet count/spleen diameter ratio for diagnosis of esophageal varices in cirrhosis: a meta-analysis.Dig Dis Sci. 2012 Jun;57(6):1672-81. doi: 10.1007/s10620-012-2058-y. Epub 2012 Feb 26. Dig Dis Sci. 2012. PMID: 22367112 Review.
Cited by
-
Νon-invasive screening for esophageal varices in patients with liver cirrhosis.Ann Gastroenterol. 2018 May-Jun;31(3):305-314. doi: 10.20524/aog.2018.0241. Epub 2018 Mar 3. Ann Gastroenterol. 2018. PMID: 29720856 Free PMC article. Review.
-
Platelet count, spleen length, and platelet count-to-spleen length ratio for the diagnosis of oesophageal varices in people with chronic liver disease or portal vein thrombosis.Cochrane Database Syst Rev. 2017 Apr 26;4(4):CD008759. doi: 10.1002/14651858.CD008759.pub2. Cochrane Database Syst Rev. 2017. PMID: 28444987 Free PMC article. Review.
-
MDCT Findings of Splenic Pathology.Curr Probl Diagn Radiol. 2022 Mar-Apr;51(2):262-269. doi: 10.1067/j.cpradiol.2020.12.004. Epub 2021 Jan 9. Curr Probl Diagn Radiol. 2022. PMID: 33461801 Free PMC article. Review.
-
Splenomegaly in Children and Adolescents.Front Pediatr. 2021 Jul 9;9:704635. doi: 10.3389/fped.2021.704635. eCollection 2021. Front Pediatr. 2021. PMID: 34307263 Free PMC article. Review.
-
[Principles and applications of susceptibility weighted imaging].Radiologe. 2016 Feb;56(2):124-36. doi: 10.1007/s00117-015-0069-3. Radiologe. 2016. PMID: 26842998 Review. German.
References
-
- Groszmann RJ, Abraldes JG (2005) Portal hypertension: from bedside to bench. J Clin Gastroenterol 39: S125–130. - PubMed
-
- Gibson PR, Gibson RN, Ditchfield MR, Donlan JD (1990) Splenomegaly–an insensitive sign of portal hypertension. Aust N Z J Med 20: 771–774. - PubMed
-
- Sagoh T, Itoh K, Togashi K, Shibata T, Nishimura K, et al. (1989) Gamna-Gandy bodies of the spleen: evaluation with MR imaging. Radiology 172: 685–687. - PubMed
-
- Witte CL, Witte MH (1983) Circulatory dynamics of the spleen. Lymphology 16: 60–71. - PubMed
-
- Elsayes KM, Narra VR, Mukundan G, Lewis JS Jr, Menias CO, et al. (2005) MR imaging of the spleen: spectrum of abnormalities. Radiographics 25: 967–982. - PubMed
MeSH terms
Substances
Grants and funding
LinkOut - more resources
Full Text Sources
Other Literature Sources
Medical
