Architecture and membrane interactions of the EGF receptor
- PMID: 23374350
- PMCID: PMC3680629
- DOI: 10.1016/j.cell.2012.12.030
Architecture and membrane interactions of the EGF receptor
Abstract
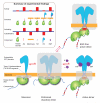
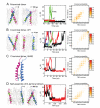
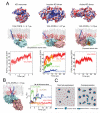
Dimerization-driven activation of the intracellular kinase domains of the epidermal growth factor receptor (EGFR) upon extracellular ligand binding is crucial to cellular pathways regulating proliferation, migration, and differentiation. Inactive EGFR can exist as both monomers and dimers, suggesting that the mechanism regulating EGFR activity may be subtle. The membrane itself may play a role but creates substantial difficulties for structural studies. Our molecular dynamics simulations of membrane-embedded EGFR suggest that, in ligand-bound dimers, the extracellular domains assume conformations favoring dimerization of the transmembrane helices near their N termini, dimerization of the juxtamembrane segments, and formation of asymmetric (active) kinase dimers. In ligand-free dimers, by holding apart the N termini of the transmembrane helices, the extracellular domains instead favor C-terminal dimerization of the transmembrane helices, juxtamembrane segment dissociation and membrane burial, and formation of symmetric (inactive) kinase dimers. Electrostatic interactions of EGFR's intracellular module with the membrane are critical in maintaining this coupling.
Copyright © 2013 Elsevier Inc. All rights reserved.
Figures


Similar articles
-
Mechanism for activation of the EGF receptor catalytic domain by the juxtamembrane segment.Cell. 2009 Jun 26;137(7):1293-307. doi: 10.1016/j.cell.2009.04.025. Cell. 2009. PMID: 19563760 Free PMC article.
-
Lipid-Protein Interplay in Dimerization of Juxtamembrane Domains of Epidermal Growth Factor Receptor.Biophys J. 2018 Feb 27;114(4):893-903. doi: 10.1016/j.bpj.2017.12.029. Biophys J. 2018. PMID: 29490249 Free PMC article.
-
Conformational coupling across the plasma membrane in activation of the EGF receptor.Cell. 2013 Jan 31;152(3):543-56. doi: 10.1016/j.cell.2012.12.032. Cell. 2013. PMID: 23374349 Free PMC article.
-
Regulation of the catalytic activity of the EGF receptor.Curr Opin Struct Biol. 2011 Dec;21(6):777-84. doi: 10.1016/j.sbi.2011.07.007. Epub 2011 Aug 23. Curr Opin Struct Biol. 2011. PMID: 21868214 Free PMC article. Review.
-
Emerging Allosteric Mechanism of EGFR Activation in Physiological and Pathological Contexts.Biophys J. 2019 Jul 9;117(1):5-13. doi: 10.1016/j.bpj.2019.05.021. Epub 2019 May 28. Biophys J. 2019. PMID: 31202480 Free PMC article. Review.
Cited by
-
The CD28 Transmembrane Domain Contains an Essential Dimerization Motif.Front Immunol. 2020 Jul 16;11:1519. doi: 10.3389/fimmu.2020.01519. eCollection 2020. Front Immunol. 2020. PMID: 32765524 Free PMC article.
-
Juxtamembrane contribution to transmembrane signaling.Biopolymers. 2015 Jul;104(4):317-22. doi: 10.1002/bip.22651. Biopolymers. 2015. PMID: 25846274 Free PMC article. Review.
-
Effects of oncogenic mutations on the conformational free-energy landscape of EGFR kinase.Proc Natl Acad Sci U S A. 2013 Jun 25;110(26):10616-21. doi: 10.1073/pnas.1221953110. Epub 2013 Jun 10. Proc Natl Acad Sci U S A. 2013. PMID: 23754386 Free PMC article.
-
Biochemical Pathways Delivering Distinct Glycosphingolipid Patterns in MDA-MB-231 and MCF-7 Breast Cancer Cells.Curr Issues Mol Biol. 2024 Sep 15;46(9):10200-10217. doi: 10.3390/cimb46090608. Curr Issues Mol Biol. 2024. PMID: 39329960 Free PMC article. Review.
-
Pharmacogenomics of EGFR-targeted therapies in non-small cell lung cancer: EGFR and beyond.Chin J Cancer. 2015 Apr 8;34(4):149-60. doi: 10.1186/s40880-015-0007-9. Chin J Cancer. 2015. PMID: 25962919 Free PMC article. Review.
References
-
- Bessman NJ, Lemmon MA. Finding the missing links in EGFR. Nat. Struct. and Mol. Biol. 2012;19:1–3. - PubMed
-
- Bocharov EV, Mineev KS, Volynsky PE, Ermolyuk YS, Tkach EN, Sobol AG, Chupin VV, Kirpichnikov MP, Efremov RG, Arseniev AS. Spatial structure of the dimeric transmembrane domain of the growth factor receptor ErbB2 presumably corresponding to the receptor active state. J. Biol. Chem. 2008;283:6950–6956. - PubMed
-
- Cho HS, Leahy DJ. Structure of the extracellular region of HER3 reveals an interdomain tether. Science. 2002;297:1330–1333. - PubMed
Publication types
MeSH terms
Substances
Grants and funding
LinkOut - more resources
Full Text Sources
Other Literature Sources
Research Materials
Miscellaneous

