. 2013 Feb 4;200(3):321-36.
doi: 10.1083/jcb.201206028. Epub 2013 Jan 28.

Interaction between autism-linked MDGAs and neuroligins suppresses inhibitory synapse development

Affiliations

Interaction between autism-linked MDGAs and neuroligins suppresses inhibitory synapse development

Katherine L Pettem et al. J Cell Biol. .

Abstract

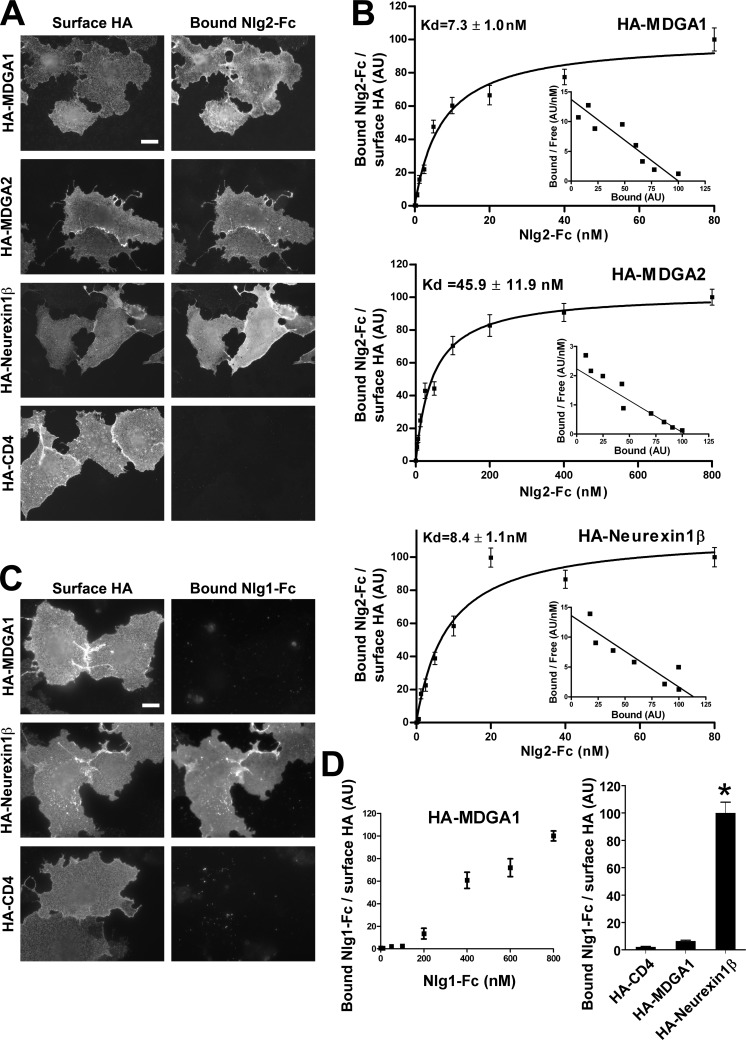
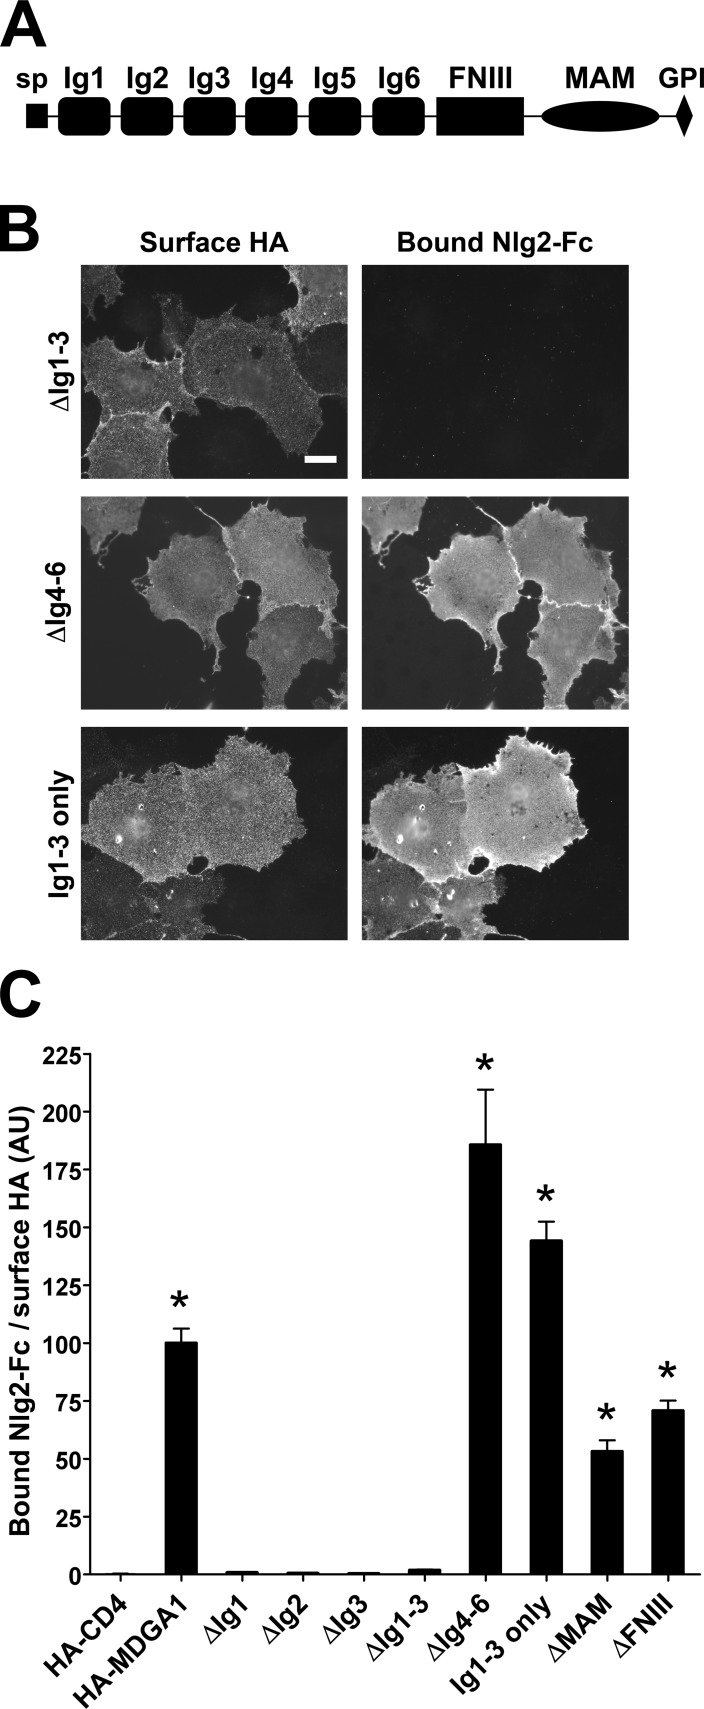
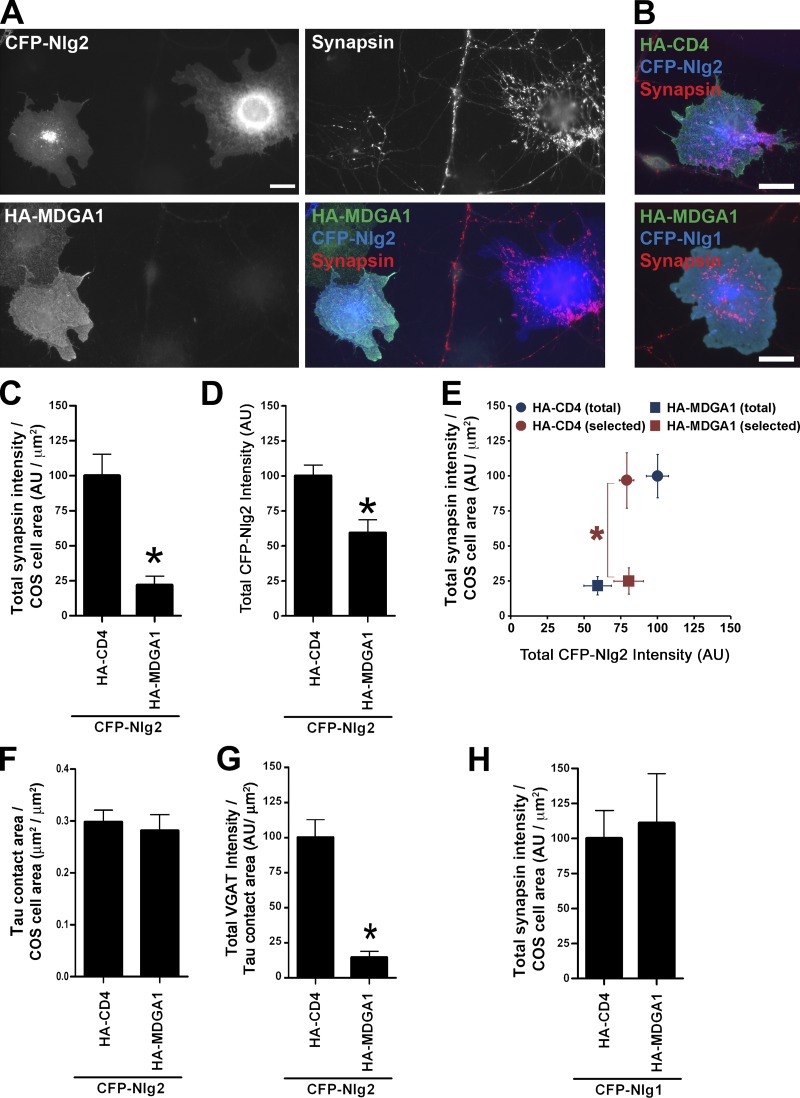
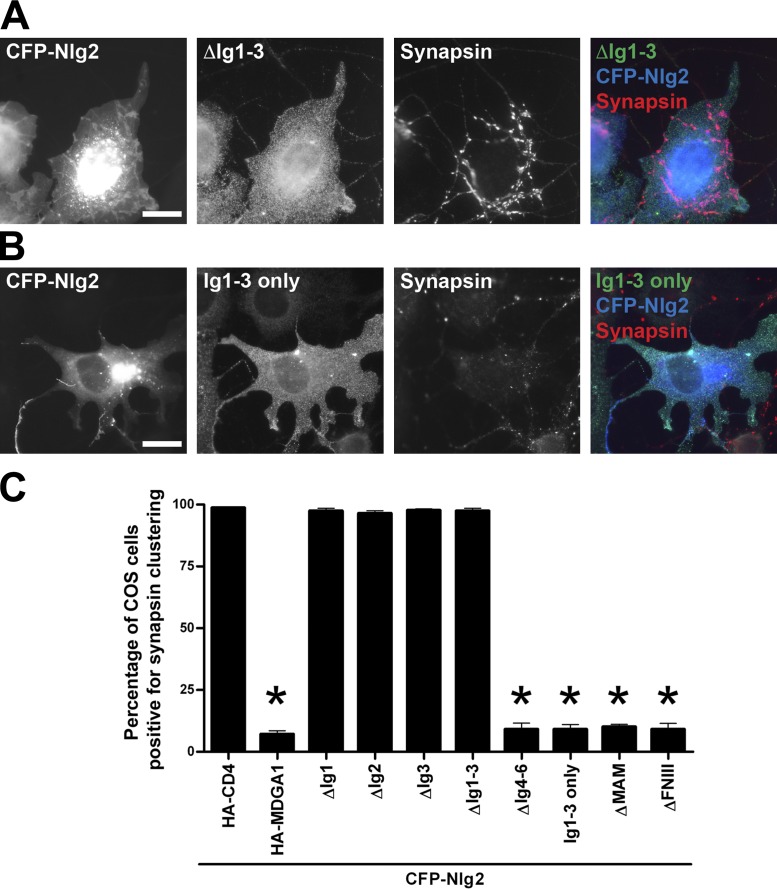
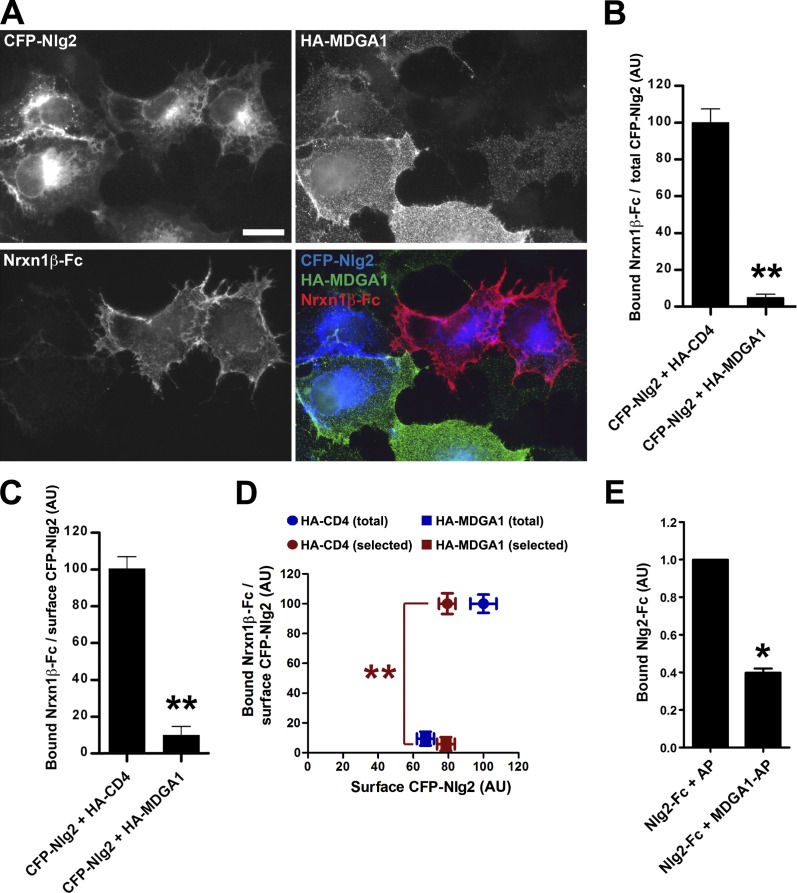
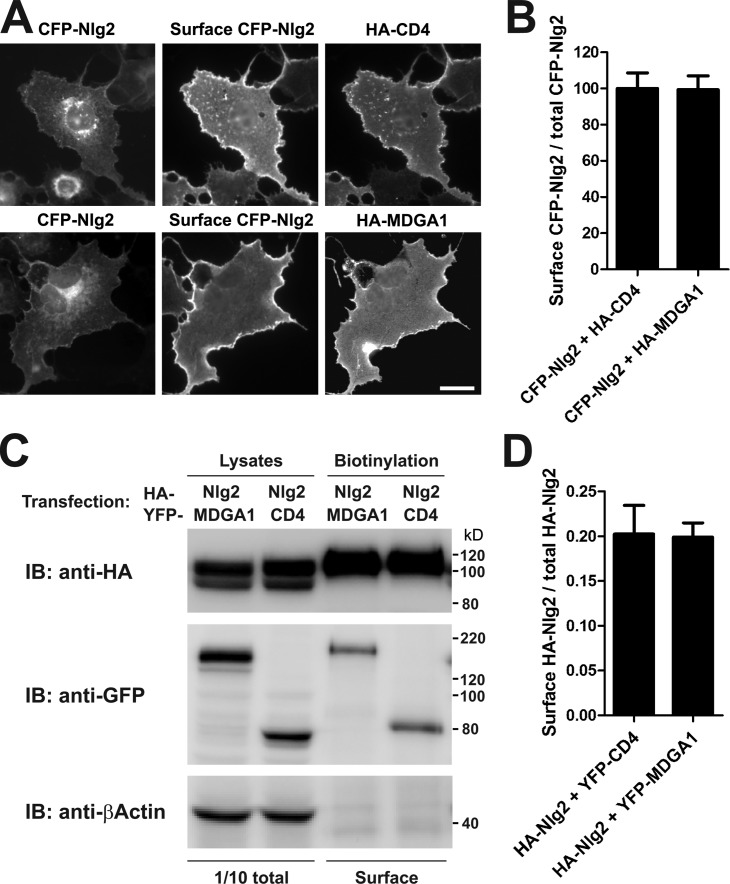
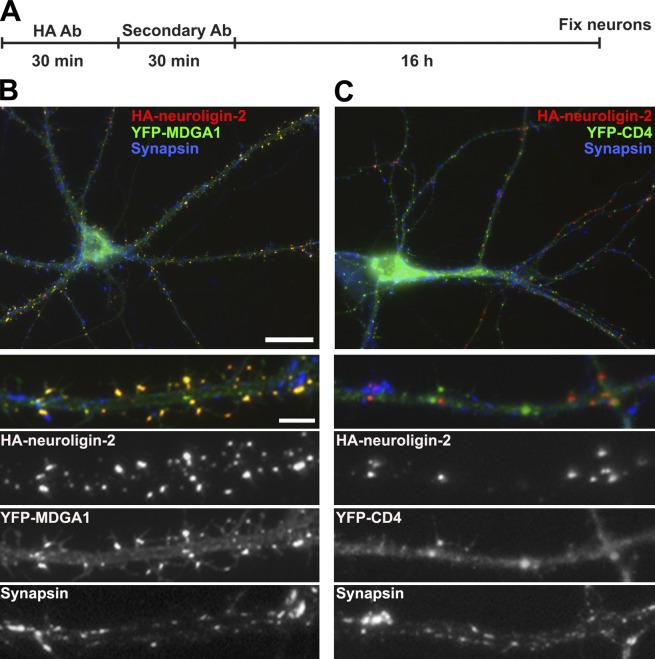
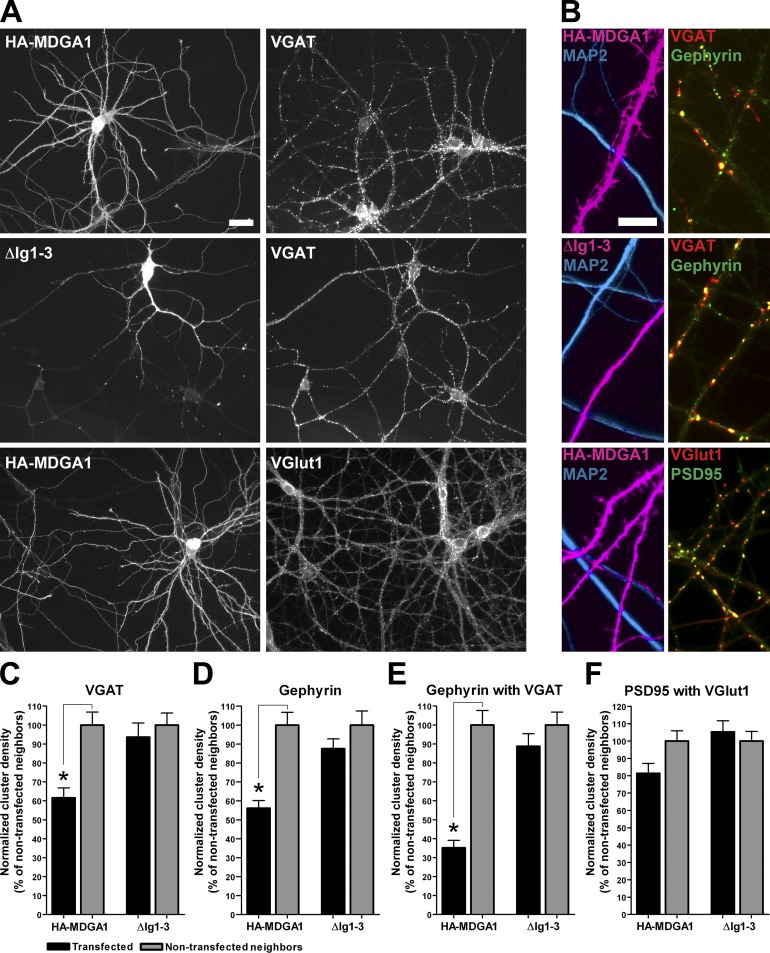
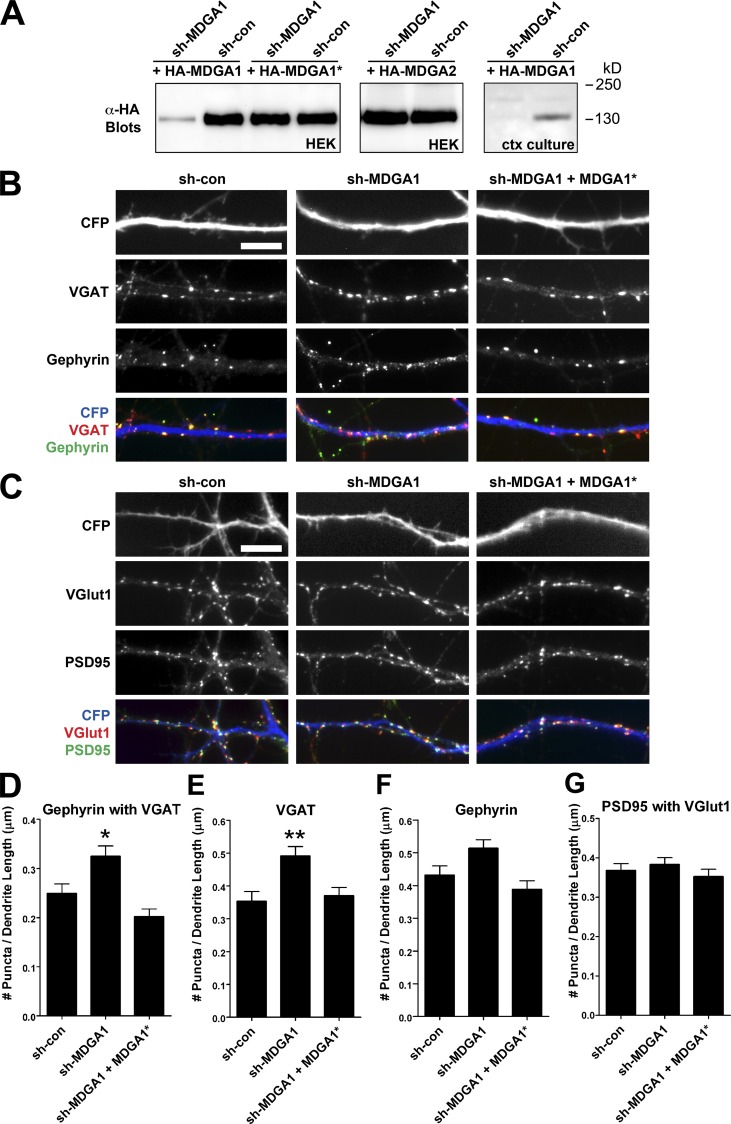
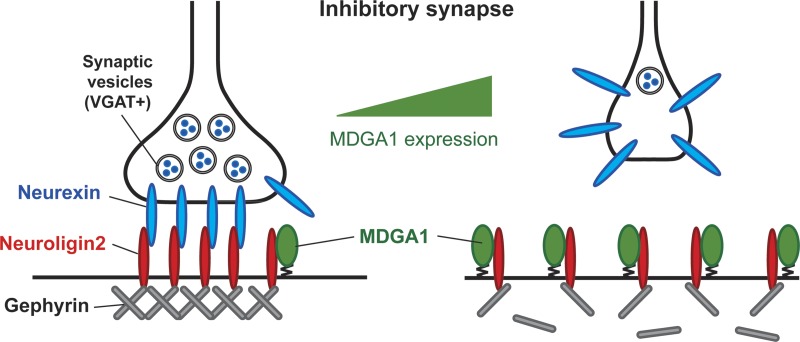
Rare variants in MDGAs (MAM domain-containing glycosylphosphatidylinositol anchors), including multiple protein-truncating deletions, are linked to autism and schizophrenia, but the function of these genes is poorly understood. Here, we show that MDGA1 and MDGA2 bound to neuroligin-2 inhibitory synapse-organizing protein, also implicated in neurodevelopmental disorders. MDGA1 inhibited the synapse-promoting activity of neuroligin-2, without altering neuroligin-2 surface trafficking, by inhibiting interaction of neuroligin-2 with neurexin. MDGA binding and suppression of synaptogenic activity was selective for neuroligin-2 and not neuroligin-1 excitatory synapse organizer. Overexpression of MDGA1 in cultured rat hippocampal neurons reduced inhibitory synapse density without altering excitatory synapse density. Furthermore, RNAi-mediated knockdown of MDGA1 selectively increased inhibitory but not excitatory synapse density. These results identify MDGA1 as one of few identified negative regulators of synapse development with a unique selectivity for inhibitory synapses. These results also place MDGAs in the neurexin-neuroligin synaptic pathway implicated in neurodevelopmental disorders and support the idea that an imbalance between inhibitory and excitatory synapses may contribute to these disorders.


Figures

Figure 1.
Figure 1.
MDGAs bind to neuroligin-2 via ectodomain interactions. (A) Soluble neuroligin-2–Fc fusion protein (Nlg2-Fc) bound to COS7 cells expressing HA-MDGA1, HA-MDGA2, or HA-neurexin1β, but not HA-CD4, on the cell surface. (B) By Scatchard analysis, binding affinity of Nlg2-Fc to HA-MDGA1, HA-MDGA2, and HA-neurexin1β was characterized by an estimated dissociation constant (Kd) of 7.3, 45.9, and 8.4 nM, respectively (n = 20 cells each data point). (C) Neuroligin-1–Fc fusion protein (Nlg1-Fc) bound clearly to COS7 cells expressing HA-neurexin1β, but not HA-MDGA1 or HA-CD4. (D) Incubation of Nlg1-Fc with COS7 cells expressing HA-MDGA1 did not yield saturable binding at concentrations up to 800 nM (n = 10 cells each). At a concentration of 200 nM Nlg1-Fc, quantitation of bound Nlg1-Fc divided by surface HA and normalized to the value for HA-neurexin1β revealed little or no Nlg1-Fc binding to COS7 cells expressing HA-MDGA1. ANOVA, P < 0.0001, n = 30 cells each; *, P < 0.001 compared with HA-CD4 by post-hoc Bonferroni test. Data are mean ± SEM. Bars, 20 µm.
Figure 2.
Figure 2.
MDGA1 Ig1-3 domains bind neuroligin-2. (A) Domain structure of MDGA1. MDGA1 is composed of an N-terminal signal peptide (sp), six immunoglobulin domains (Ig), a fibronectin type III domain (FNIII), a memprin, A5 protein, receptor tyrosine phosphatase mu (MAM) domain, and a C-terminal GPI anchor. (B) Representative images from binding assays of Nlg2-Fc to HA-MDGA1 mutants. Nlg2-Fc bound to HA-MDGA1 lacking the last three Ig domains (ΔIg4-6), but not HA-MDGA1 lacking the first three Ig domains (ΔIg1-3). Note that the first three Ig domains of MDGA1 plus the GPI anchor (Ig1-3 only) were sufficient for Nlg2-Fc binding. (C) Quantitation of Nlg2-Fc bound to HA-MDGA1 mutants, divided by surface HA and normalized to the value for HA-MDGA1. The membrane-associated Ig1-3 domains were necessary and sufficient for binding of Nlg2-Fc. ANOVA, P < 0.0001, n ≥ 45 cells each; *, P < 0.001 compared with HA-CD4 by post-hoc Bonferroni test. Data are mean ± SEM. Bar, 20 µm.
Figure 3.
Figure 3.
MDGA1 inhibits the synaptogenic activity of neuroligin-2. (A) COS7 cells were cotransfected with CFP–neuroligin-2 (CFP-Nlg2) and HA-MDGA1, then co-cultured with hippocampal neurons. COS7 cells expressing only CFP-Nlg2 (e.g., COS7 cell on right) induced robust clustering of synapsin in contacting axons, whereas COS7 cells coexpressing HA-MDGA1 with CFP-Nlg2 (e.g., COS7 cell on left) showed diminished synapsin clustering. (B) Robust synapsin clustering was detected in axons contacting COS7 cells coexpressing HA-CD4 with CFP-Nlg2 (top) or coexpressing HA-MDGA1 with CFP–neuroligin-1 (CFP-Nlg1, bottom). (C) Quantitation of total integrated intensity of synapsin immunofluorescence not associated with MAP2 and associated with COS7 cells coexpressing HA-CD4 or HA-MDGA1 with CFP-Nlg2, divided by COS7 cell area and normalized to the value for HA-CD4. t test; *, P < 0.0001, n = 20 cells each. (D) Quantitation of total fluorescent intensity of CFP-Nlg2 on the COS7 cells used for C. t test; *, P < 0.0001, n = 20 cells each. (E) Comparison of total integrated synapsin intensity of selected COS7 cells expressing HA-MDGA1 or HA-CD4 with similar total CFP-Nlg2 expression level (n = 13 cells each, red symbols). t test; *, P < 0.0001. Full datasets from C and D are shown for comparison (blue symbols). (F) Quantitation of tau-positive axon contact area on COS7 cells coexpressing HA-CD4 or HA-MDGA1 with CFP-Nlg2, divided by COS7 cell area. t test, P = 0.67, n = 20 cells each. (G) Quantitation of total integrated intensity of VGAT immunofluorescence not associated with MAP2 and associated with COS7 cells coexpressing HA-CD4 or HA-MDGA1 with CFP-Nlg2, divided by tau-positive axon contact area and normalized to the value for HA-CD4. t test; *, P < 0.0001, n = 20 cells each. (H) Quantitation of total integrated intensity of synapsin immunofluorescence not associated with MAP2 and associated with COS7 cells coexpressing HA-CD4 or HA-MDGA1 with CFP-Nlg1, divided by COS7 cell area and normalized to the value for HA-CD4. t test, P = 0.78, n = 20 cells each. Data are mean ± SEM. Bars, 20 µm.
Figure 4.
Figure 4.
MDGA1 Ig1-3 domains suppress neuroligin-2 synaptogenic activity. (A and B) Co-expression of HA-MDGA1 Ig1-3 only (B), but not HA-MDGA1 ΔIg1-3 (A), diminished CFP–neuroligin-2 (CFP-Nlg2)–induced synapsin clustering. (C) Quantitation of the effect of MDGA1 mutants on CFP-Nlg2–induced synapsin clustering in the co-culture assay. Data are expressed as a percentage of COS7 cells coexpressing the indicated construct with CFP-Nlg2 that exhibited synapsin clustering in MAP2-negative contacting neurites. The membrane-anchored Ig1-3 domains of MDGA1 were necessary and sufficient for inhibiting the activity of neuroligin-2 to induce synapsin clustering. ANOVA, P < 0.0001, n ≥ 3 experiments counting ≥100 cells each; *, P < 0.01 compared with HA-CD4 by post-hoc Bonferroni test. Data are mean ± SEM. Bars, 20 µm.
Figure 5.
Figure 5.
MDGA1 inhibits the binding of neurexin1β to neuroligin-2. (A) COS7 cells were transfected with CFP–neuroligin-2 (CFP-Nlg2) and HA-MDGA1. Soluble neurexin1β-Fc fusion protein (Nrxn1β-Fc) bound to cells expressing only CFP-Nlg2 (cells in top right of image), but did not bind to cells coexpressing HA-MDGA1 with CFP-Nlg2 (cells in bottom left of image). (B–D) Quantitation of Nrxn1β-Fc bound to COS7 cells expressing the indicated constructs, divided by total CFP-Nlg2 (B) or by surface CFP-Nlg2 (C and D) and normalized to the value for HA-CD4. HA-MDGA1 compared with HA-CD4 reduced the total and surface levels of CFP-Nlg2, so a subset of cells selected for equal surface expression of CFP-Nlg2 was also compared (red in D; the full dataset is shown for comparison in blue). t test; **, P < 0.0001, n = 20–30 cells each. (E) Purified neurexin1β-AP (alkaline phosphatase) fusion protein immobilized on plates was incubated with purified Nlg2-Fc together with either MDGA1-AP or AP control. Bound Nlg2-Fc measured by ELISA was reduced in the presence of MDGA1-AP. t test; *, P < 0.005, n = 3.
Figure 6.
Figure 6.
MDGA1 does not alter surface trafficking of neuroligin-2. (A) COS7 cells were transfected with CFP–neuroligin-2 (CFP-Nlg2) and either HA-MDGA1 or control HA-CD4. Surface trafficking of CFP-Nlg2 was visualized by incubating intact cells with anti-GFP antibodies (which recognize CFP). Ratio of surface to total CFP-Nlg2 did not appear affected by MDGA1. (B) Quantitation of surface trafficking of CFP-Nlg2 on COS7 cells coexpressing HA-MDGA1 or HA-CD4, assessed as intensity ratio of surface anti-GFP antibody signal to CFP signal. t test, P = 0.63, n = 20 cells each. (C) HEK293T cells were transfected to express the indicated constructs and surface proteins were biotinylated and isolated. Immunoblotting of surface-biotinylated proteins in comparison with whole-cell lysates revealed equivalent surface trafficking of HA–neuroligin-2 (HA-Nlg2) in the presence of YFP-tagged MDGA1 or CD4. (D) Quantitation of the ratio of surface-biotinylated to total HA-Nlg2 in cells coexpressing YFP-MDGA1 or YFP-CD4. t test, P = 0.92, n = 4. Data are mean ± SEM. Bar, 10 µm.
Figure 7.
Figure 7.
MDGA1 and neuroligin-2 can interact in cis on dendrites. Cultured hippocampal neurons were transfected with HA–neuroligin-2 and YFP-MDGA1 or YFP-CD4 control. (A) Live neurons were incubated with rat anti-HA antibody and then Alexa 568–conjugated goat anti–rat antibody to induce surface patching of HA–neuroligin-2, incubated another 16 h, fixed, and imaged. YFP-MDGA1 (B) but not control protein YFP-CD4 (C) co-aggregated with HA–neuroligin-2 at nonsynaptic clusters (lacking apposed synapsin). Bars: (whole cell) 20 µm; (enlarged dendrite regions) 5 µm.
Figure 8.
Figure 8.
MDGA1 overexpression reduces inhibitory synapse density. Cultured hippocampal neurons were transfected at 8–9 DIV with HA-MDGA1 or ΔIg1-3 as a negative control, and then immunostained for indicated synaptic markers and HA tag at 14 DIV. (A) Neurons expressing HA-MDGA1 (top) showed an apparent reduction in inputs with inhibitory presynaptic marker VGAT compared with neighboring untransfected neurons or neurons expressing ΔIg1-3 (middle). Neurons expressing HA-MDGA1 appeared to have normal inputs with excitatory presynaptic marker VGlut1 (bottom). (B) Clusters of VGAT and gephyrin were hardly detected along dendrites expressing HA-MDGA1 (pink, top), whereas such clusters were more readily detected along nontransfected neighboring dendrites (blue, top) or dendrites expressing ΔIg1-3 (pink, middle). Clusters of VGlut1 and PSD-95 along dendrites expressing HA-MDGA1 (pink, bottom) appeared comparable to those along nontransfected neighboring dendrites (blue, bottom). (C–F) Quantitation of number of clusters per dendrite length for VGAT (C), gephyrin (D), VGAT-positive gephyrin (marking inhibitory synapses, E), and VGlut1-positive PSD95 (marking excitatory synapses, F) in neurons overexpressing HA-MDGA1 or negative control ΔIg1-3. Data are normalized by the value for nontransfected neighboring neurons (gray). ANOVA, P < 0.0001 for C–E and P = 0.03 for F; n = 30 cells each; *, P < 0.001 in post-hoc Bonferroni test (P > 0.05 in post-hoc Bonferroni test for PSD-95 with VGlut1 for HA-MDGA1 compared with nontransfected neighbors). Data are mean ± SEM. Bars: (A) 30 µm; (B) 10 µm.
Figure 9.
Figure 9.
MDGA1 knockdown increases inhibitory synapse density. Cultured hippocampal neurons were transfected at 8–9 DIV with a vector coexpressing CFP and a short-hairpin RNA (shRNA) construct corresponding to control shRNA (sh-con) or sh-RNA effective to knock down MDGA1 (sh-MDGA1). Neurons were analyzed at 14 DIV. (A) For shRNA validation, cotransfection of sh-MDGA1 but not sh-con reduced expression of HA-MDGA1 but not the RNAi-resistant form HA-MDGA1* in HEK cells (left gel). Neither sh-con nor sh-MDGA1 reduced expression of HA-MDGA2 in cotransfected HEK cells (middle gel). Knockdown of MDGA1 was also confirmed in cotransfected cortical cultured neurons (ctx culture, right gel). (B and C) In cultured neurons, MDGA1 knockdown appeared to increase the number of VGAT and gephyrin clusters along dendrites (B) but to have no effect on VGlut1 and PSD-95 (C). Co-expression of RNAi-resistant HA-MDGA1* with sh-MDGA1 appeared to normalize clustering of VGAT and gephyrin (B, right column). (D–G) Quantitation of cluster density for VGAT-positive gephyrin marking inhibitory synapses (D), VGAT (E), and gephyrin (F) individually, and VGlut1-positive PSD-95 marking excitatory synapses (G). MDGA1 knockdown selectively increased inhibitory synapse density, with a greater effect on VGAT than on gephyrin. This effect was completely rescued by coexpression of MDGA1*. ANOVA, P < 0.0001 for D, P = 0.0013 for E, P = 0.0056 for F, and P = 0.48 for G; n ≥ 40 cells each; *, P < 0.05; **, P < 0.01 compared with sh-con in post-hoc Bonferroni test (P > 0.05 in post-hoc Bonferroni test for gephyrin for sh-MDGA1 compared with sh-con). Data are mean ± SEM. Bars, 10 µm.
Figure 10.
Figure 10.
Model of how MDGA1 may suppress inhibitory synapse development. Data presented here indicate that MDGA1 binds neuroligin-2 and inhibits its interaction with neurexin, without altering surface trafficking of neuroligin-2. Thus, we propose that high levels of MDGA1 in neurons may suppress inhibitory synapse formation or destabilize inhibitory synapses, resulting in a net reduction in inhibitory synapse density.

Similar articles

Cited by

References

    1. Auerbach B.D., Osterweil E.K., Bear M.F. 2011. Mutations causing syndromic autism define an axis of synaptic pathophysiology. Nature. 480:63–68 10.1038/nature10658 - DOI - PMC - PubMed
    1. Betancur C., Sakurai T., Buxbaum J.D. 2009. The emerging role of synaptic cell-adhesion pathways in the pathogenesis of autism spectrum disorders. Trends Neurosci. 32:402–412 10.1016/j.tins.2009.04.003 - DOI - PMC - PubMed
    1. Biederer T., Sara Y., Mozhayeva M., Atasoy D., Liu X., Kavalali E.T., Südhof T.C. 2002. SynCAM, a synaptic adhesion molecule that drives synapse assembly. Science. 297:1525–1531 10.1126/science.1072356 - DOI - PubMed
    1. Boucard A.A., Chubykin A.A., Comoletti D., Taylor P., Südhof T.C. 2005. A splice code for trans-synaptic cell adhesion mediated by binding of neuroligin 1 to alpha- and beta-neurexins. Neuron. 48:229–236 10.1016/j.neuron.2005.08.026 - DOI - PubMed
    1. Bourgeron T. 2009. A synaptic trek to autism. Curr. Opin. Neurobiol. 19:231–234 10.1016/j.conb.2009.06.003 - DOI - PubMed

Publication types

MeSH terms