. 2013 Mar;45(3):253-61.
doi: 10.1038/ng.2538. Epub 2013 Jan 27.

Recurrent somatic mutation of FAT1 in multiple human cancers leads to aberrant Wnt activation

Affiliations

Recurrent somatic mutation of FAT1 in multiple human cancers leads to aberrant Wnt activation

Luc G T Morris et al. Nat Genet. 2013 Mar.

Abstract

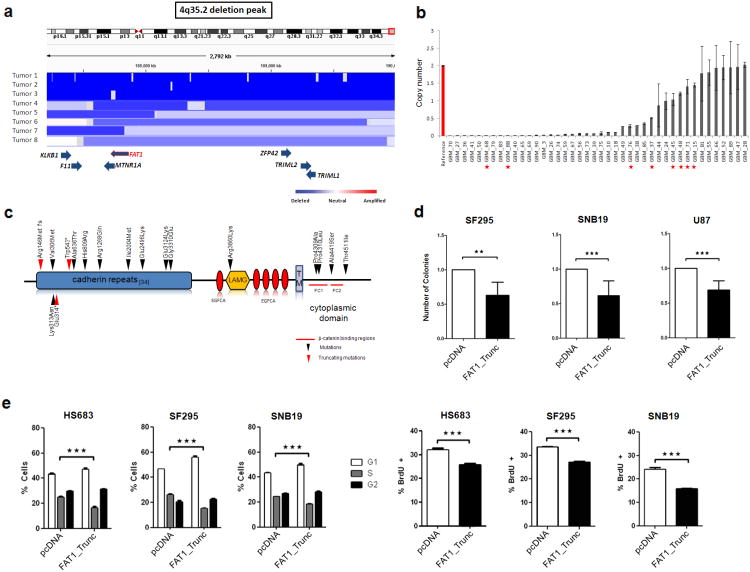
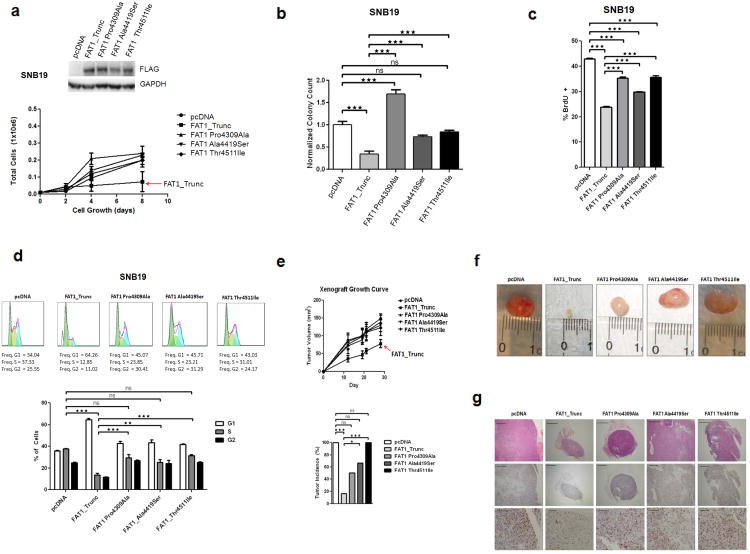
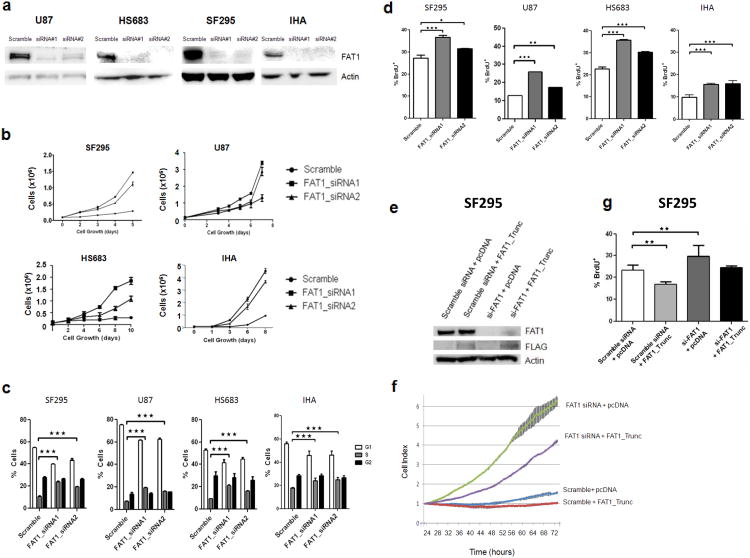
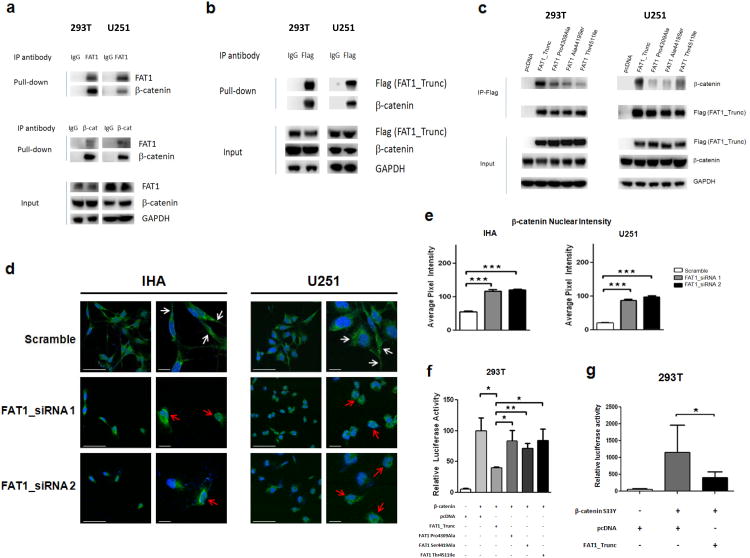
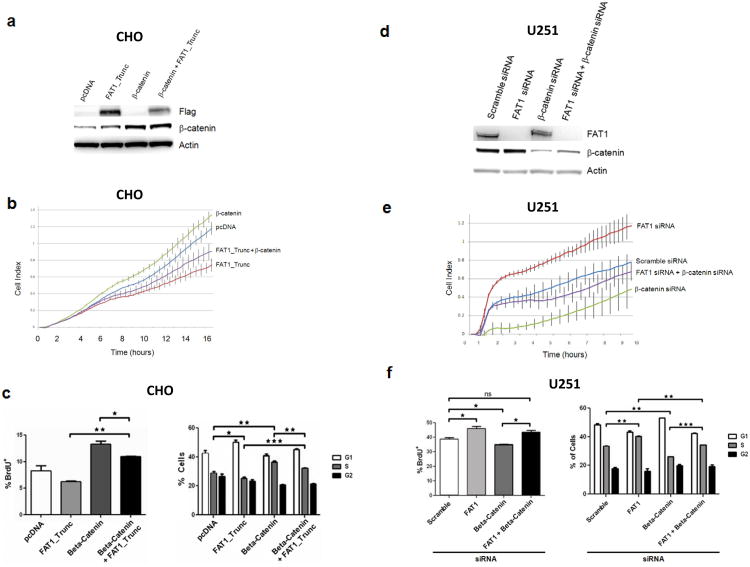
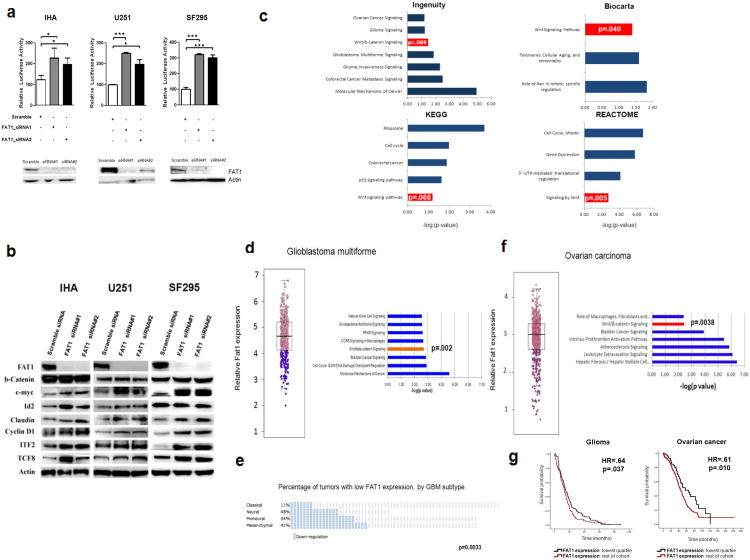
Aberrant Wnt signaling can drive cancer development. In many cancer types, the genetic basis of Wnt pathway activation remains incompletely understood. Here, we report recurrent somatic mutations of the Drosophila melanogaster tumor suppressor-related gene FAT1 in glioblastoma (20.5%), colorectal cancer (7.7%), and head and neck cancer (6.7%). FAT1 encodes a cadherin-like protein, which we found is able to potently suppress cancer cell growth in vitro and in vivo by binding β-catenin and antagonizing its nuclear localization. Inactivation of FAT1 via mutation therefore promotes Wnt signaling and tumorigenesis and affects patient survival. Taken together, these data strongly point to FAT1 as a tumor suppressor gene driving loss of chromosome 4q35, a prevalent region of deletion in cancer. Loss of FAT1 function is a frequent event during oncogenesis. These findings address two outstanding issues in cancer biology: the basis of Wnt activation in non-colorectal tumors and the identity of a 4q35 tumor suppressor.


Figures

Figure 1
Figure 1. The FAT1 gene is deleted and mutated at a high prevalence across multiple human cancers, and FAT1 suppresses cancer cell growth and proliferation
(a) Array CGH segmentation map showing select tumors with FAT1 deletions in the Tumorscape dataset (genomic coordinates at top). FAT1 and surrounding genes are indicated at bottom with blue arrows. Lower right, color legend showing copy number status. (b) FAT1 copy number assayed via quantitative polymerase chain reaction in reference normal (red) and 42 glioblastoma samples (grey), demonstrating homozygous deletions in 24. Error bars represent 1 standard deviation. Red asterisks indicate tumors with FAT1 mutations. All assays performed in triplicate. (c) Schematic of FAT1 is shown with locations of mutations. Arrowheads indicate the location of point mutations and boxes represent functional domains (TM, transmembrane; LAMG, laminin G domain; EGFCA, epidermal growth factor-like repeat; *, stop codon; fs, frameshift). Red arrows denote frameshift or truncating mutations. Red lines indicate putative β-catenin binding regions. (d) Colony-formation assays in indicated glioma cell lines demonstrate significant reduction in colony number when cells are transfected with FAT1_Trunc. Experiments performed in quadruplicate, colony number normalized to empty vector (pcDNA) = 1.0. (e) Cell cycle analyses (left) demonstrate a significant reduction in S phase cells, in cells transfected with FAT1. BrdU assays (right) show a reduction in DNA synthesis in cells transfected with FAT1. Cell lines indicated. Experiments performed in triplicate. Error bars represent 1 standard deviation. *p<.05, **p<.01, ***p<.001, t-test and ANOVA.
Figure 2
Figure 2. The growth suppressive properties of FAT1 are abrogated by mutations observed in cancer
(a) Western blot of stable FAT1-expressing SNB19 GBM cells (above). Growth curve (below) demonstrating suppression of growth by non-mutated FAT1, but not by mutatedFAT1. Error bars represent 1 standard deviation. (b) Soft agar assay of SNB19 cells stably transfected with empty vector, non-mutated FAT1, or mutated FAT1, demonstrating significant suppression of anchorage-independent growth in cells transfected with FAT1, but not when transfected with empty vector or mutated FAT1. (c) BrdU assay and (d) Cell cycle assays in stable FAT1-transfected SNB19 GBM cells demonstrate that the anti-proliferative effect of FAT1 is compromised by FAT1 mutations. Error bars represent 1 standard deviation. (e) Xenograft assay growth curve (above) shows reduction in tumor growth in stable FAT1-transfected SNB19 cells, but not in mutated FAT1-transfected cells. Tumor incidence (below) at time of sacrifice at week 19 shows lowest tumor incidence in FAT1-transfected xenografts, compared to empty vector or mutated FAT1. (f) Representative photographs of xenografts (week 19) demonstrates significant growth suppression in FAT1-transfected cells, but not in mutated FAT1-transfected cells. (g) Representative photomicrographs of xenografts. Hematoxylin and eosin-stained sections at 4× power (top row) confirm invasive cancer in all xenografts. Immunohistochemistry for the proliferation marker Ki-67 at 4× power (middle row), and 20× power (bottom row) demonstrate marked suppression of cellular proliferation in FAT1-transfected cells, not seen with mutated FAT1. Scale bars represent 500μm (top, middle rows) and 100μm (bottom row). *p<.05, **p<.01, ***p<.001, ns, non-significant, t-test and ANOVA.
Figure 3
Figure 3. FAT1 inactivation results in increased cancer cell growth and proliferation
(a) Western Blots demonstrating knockdown of FAT1 expression with 2 siRNAs in the indicated cells. “Scramble” is non-targeting siRNA. (b) Cell growth curves demonstrating increased growth with FAT1 knockdown, in indicated cells. Experiments performed in triplicate. (c) Cell cycle analysis reveals increased number of cells entering S phase after FAT1 knockdown. Indicated cell lines were either treated with one of 2 FAT1 siRNAs or scrambled siRNA control, in triplicate. (d) BrdU incorporation assays reveal increased DNA synthesis after FAT1 knockdown. Experiments performed in triplicate. Error bars represent 1 standard deviation. (e) Western blot demonstrating concomitant FAT1 knockdown with siRNA, and FAT1_Trunc construct transfection, in SF295 cells. Antibodies indicated. (f) Growth curve demonstrating accelerated growth after FAT1 knockdown, partially reversed with concomitant transfection of FAT1_Trunc, in SF295 cells. Error bars represent 1 standard deviation. Experiments performed in quadruplicate. Cells were plated for xCELLigence growth curve 24 hours after transfection, and data shown at the start of cell proliferation (see Methods). (g) BrdU incorporation assay reveals increased DNA synthesis after FAT1 knockdown, reversed after concurrent FAT1_Trunc overexpression. Experiments performed in triplicate. Error bars represent 1 standard deviation. *p<.05, **p<.01, ***p<.001, Fisher's exact test and one-way ANOVA.
Figure 4
Figure 4. FAT1 is a β-catenin binding partner, inactivation of which causes aberrant Wnt pathway activation, translocation of β-catenin to the nucleus, and enhanced β-catenin-mediated transcription
(a) Immunoprecipitation assays in indicated FAT1-expressing cell lines demonstrate that endogenous FAT1 binds endogenous β-catenin (top), and vice versa (middle). Antibody or IgG negative control as indicated. (b) Immunoprecipitation assays demonstrate binding of transfected FAT1_Trunc to endogenous β-catenin. (c) Immunoprecipitation of FLAG-tagged FAT1 constructs show loss of β-catenin binding in mutated FAT1. (d) Translocation of β-catenin to the nucleus after FAT1 knockdown in GBM cells and immortalized human astrocytes (IHA). Cells were treated with indicated siRNAs; 48 hours later, cells were stained with DAPI (blue) and antibody against β-catenin (green). Representative photos from 3 independent repeat experiments, at lower and higher magnification. White arrows denote plasma membrane localization; red arrows, nuclear/perinuclear localization. Scale barsrepresent 50 μm. (e) Quantification of results from (d). Nuclear staining expressed as pixel intensity, demonstrating increased nuclear localization of β-catenin after FAT1 knockdown. (f) TOPFLASH reporter assay demonstrates reduction in β-catenin-dependent transcription following expression of non-mutated FAT1, but not FAT1 mutant constructs, in 293T cells. Reporter assays were performed as previously described, and luciferase activity reported as relative fluorescence units for TOPFLASH, divided by fluorescence activity for the control (FOPFLASH). Error bars represent 1 standard deviation. (g) Luciferase assay shows substantially increased β-catenin-mediated transcription after transfection with constitutively active β-catenin S33Y mutant, repressed with co-transfection of FAT1. *p<.05, **p<.01, ***p<.001, t-test and ANOVA.
Figure 5
Figure 5. Functional relationship between β-catenin and FAT1 in the regulation of proliferation
(a) Western blot showing co-transfection of β-catenin and FAT1 in chinese hamster ovary (CHO) cells. (b) Growth curve demonstrating accelerated cell growth with over-expression of β-catenin, repressed with co-transfection with FAT1. Error bars represent 1 standard deviation. Experiments performed in CHO cells, in quadruplicate. (c) BrdU (left) and cell cycle (right) assays demonstrate enhancement in DNA synthesis and cells entering S phase, after β-catenin over-expression, repressed with FAT1 co-transfection. Experiments performed in CHO cells, in triplicate. (d) Western blot showing co-transfection of siRNAs targeting FAT1 and β-catenin, in U251 glioma cells. (e) Growth curve demonstrating accelerated growth after FAT1 knockdown, reversed by concurrent knockdown of β-catenin. Error bars represent 1 standard deviation. Experiments performed in quadruplicate, in U251 glioma cells. (f) BrdU (left) and cell cycle (right) assays demonstrate enhancement in DNA synthesis and cells entering S phase, after FAT1 knockdown, repressed with concurrent β-catenin knockdown, in U251 glioma cells. Experiments performed in triplicate. These data are shown with a 2nd set of siRNAs in Supplementary Fig. 3. *p<.05, **p<.01, ***p<.001 ANOVA.
Figure 6
Figure 6. Effects on Wnt/β-catenin signaling after FAT1 inactivation
(a) Western blots (below) demonstrate knockdown of FAT1 with 2 siRNAs, in the indicated immortalized astrocyte (IHA) and glioma cell lines. TOPFLASH luciferase reporter assay demonstrates increased β-catenin-dependent transcription following knockdown of FAT1 (above). Error bars represent 1 standard deviation. *p<.05, **p<.01, ANOVA. (b) Western blot showing upregulation of multiple Wnt targets (but not β-catenin) after FAT1 knockdown. (c) Pathway analyses performed on 1539 genes differentially expressed across all cell lines and FAT1 siRNAs demonstrate significant enrichment of Wnt/β-catenin signaling across four independent pathway analysis modules. P values calculated using the Fisher test (Ingenuity), or the EASE score (Biocarta, KEGG, Reactome), are conservative estimates, depicted by log scale (–log10 p-value). Hypergeometric distribution values are p=.00009 (Ingenuity), p=.0039 (Biocarta), p=.0007 (Reactome), and p=.015 (KEGG). (d) Dichotomous categorization of 404 GBMs as low (lowest quartile; purple) or normal FAT1 expressors (left), identified 1035 differentially expressed genes. Enrichment of Wnt/β-catenin-associated genes in low FAT1 expressors was demonstrated by Ingenuity Pathway Analysis (right). (e) Of the 4 expression-defined subtypes of glioblastoma, low FAT1-expressing tumors were most prevalent in the Neural and Mesenchymal groups, and less common than expected in the Classical group (p=.0033). (f) Dichotomous categorization of 590 ovarian cancers as low (lowest quartile) or normal FAT1 expressors (left), identified 189 differentially expressed genes. Pathway enrichment demonstrated by Ingenuity Pathway Analysis (right). (g) Glioma and ovarian cancer patients with low FAT1 expressing tumors experienced longer survival in the NCI Rembrandt glioma and TCGA ovarian cancer datasets.

Comment in

Similar articles

Cited by

References

    1. Borkosky SS, et al. Frequent deletion of ING2 locus at 4q35.1 associates with advanced tumor stage in head and neck squamous cell carcinoma. J Cancer Res Clin Oncol. 2009;135:703–13. - PubMed
    1. Brosens RP, et al. Deletion of chromosome 4q predicts outcome in stage II colon cancer patients. Anal Cell Pathol (Amst) 2010;33:95–104. - PMC - PubMed
    1. Nakamura E, et al. Frequent silencing of a putative tumor suppressor gene melatonin receptor 1 A (MTNR1A) in oral squamous-cell carcinoma. Cancer Sci. 2008;99:1390–400. - PMC - PubMed
    1. Nakaya K, et al. Identification of homozygous deletions of tumor suppressor gene FAT in oral cancer using CGH-array. Oncogene. 2007;26:5300–8. - PubMed
    1. TCGA. Comprehensive genomic characterization defines human glioblastoma genes and core pathways. Nature. 2008;455:1061–8. - PMC - PubMed

Publication types

Associated data