. 2013 Feb;15(2):201-13.
doi: 10.1038/ncb2672. Epub 2013 Jan 27.

GATA3 suppresses metastasis and modulates the tumour microenvironment by regulating microRNA-29b expression

Affiliations

GATA3 suppresses metastasis and modulates the tumour microenvironment by regulating microRNA-29b expression

Jonathan Chou et al. Nat Cell Biol. 2013 Feb.

Abstract

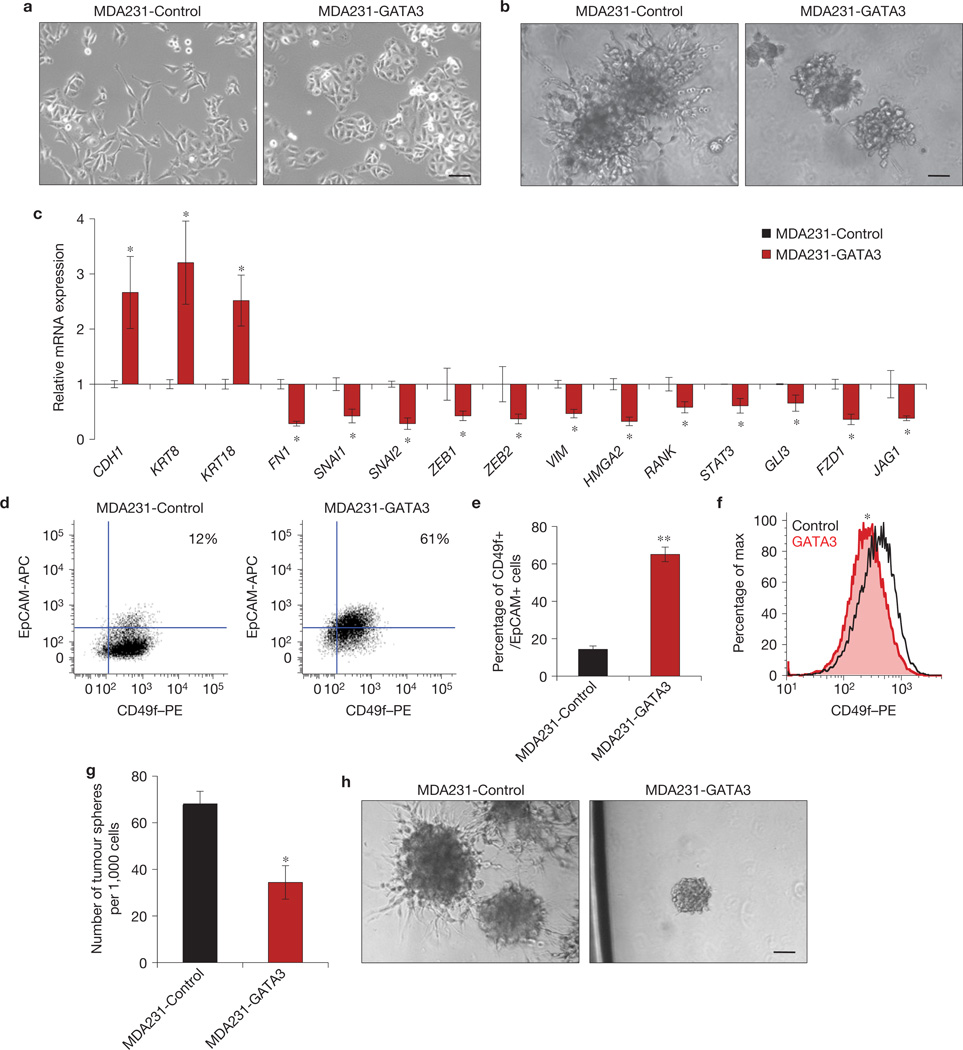
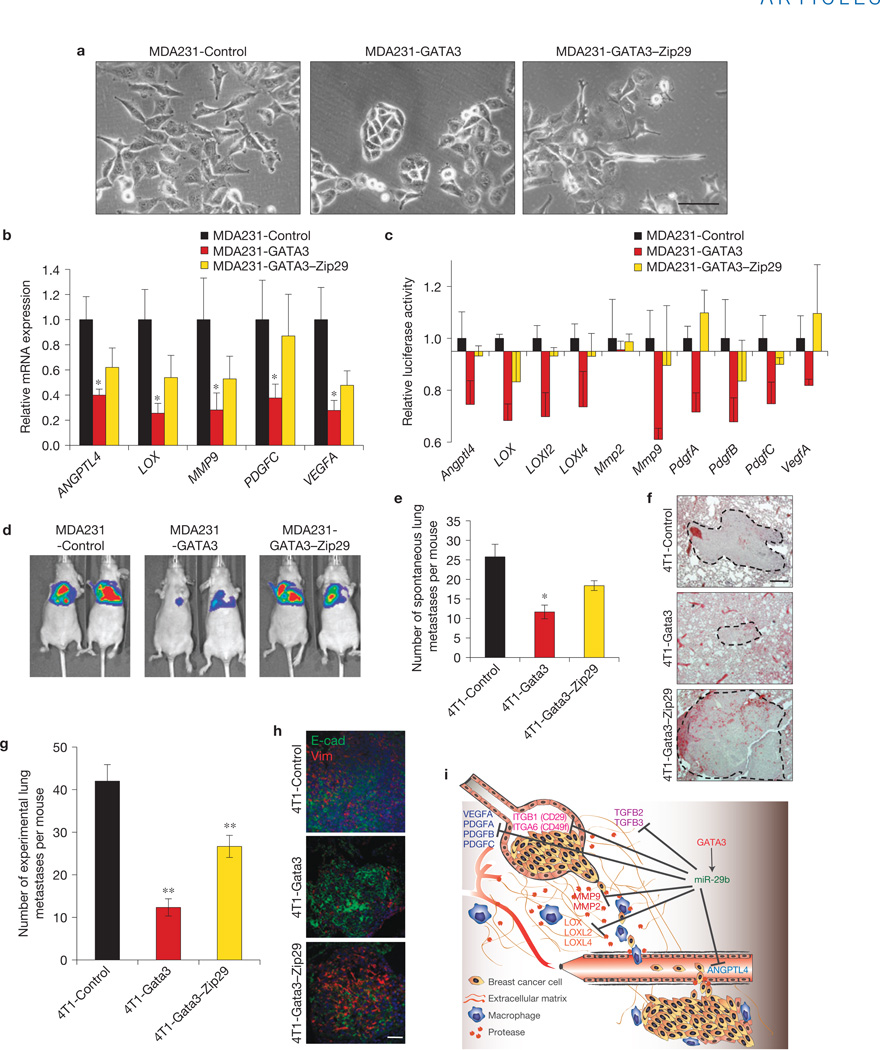
Despite advances in our understanding of breast cancer, patients with metastatic disease have poor prognoses. GATA3 is a transcription factor that specifies and maintains mammary luminal epithelial cell fate, and its expression is lost in breast cancer, correlating with a worse prognosis in human patients. Here, we show that GATA3 promotes differentiation, suppresses metastasis and alters the tumour microenvironment in breast cancer by inducing microRNA-29b (miR-29b) expression. Accordingly, miR-29b is enriched in luminal breast cancers and loss of miR-29b, even in GATA3-expressing cells, increases metastasis and promotes a mesenchymal phenotype. Mechanistically, miR-29b inhibits metastasis by targeting a network of pro-metastatic regulators involved in angiogenesis, collagen remodelling and proteolysis, including VEGFA, ANGPTL4, PDGF, LOX and MMP9, and targeting ITGA6, ITGB1 and TGFB, thereby indirectly affecting differentiation and epithelial plasticity. The discovery that a GATA3-miR-29b axis regulates the tumour microenvironment and inhibits metastasis opens up possibilities for therapeutic intervention in breast cancer.


Figures

Figure 1
Figure 1
GATA3 suppresses spontaneous and experimental breast cancer metastases to the lungs. (a) GATA3 expression levels from basal A, basal B and luminal breast cancer cell lines. Microarray data set is adapted from ref. . ** one-way analysis of variance P < 0.001. (b) Relative Gata3 levels in 4T1 cells ± Gata3 measured by qPCR (n = 8 independently obtained biological samples, **P < 0.001). (cg) BALB/c mice were injected with 4T1 cells ± Gata3 into the inguinal mammary fat pad. Tumours were allowed to grow for three weeks and measured (c) and immunohistochemical staining for GATA3 in primary tumours was performed (d). The lungs were collected and examined for metastases (e). (n = 12 independent mice per group, *P < 0.01.) Representative H&E images (f) and immunohistochemical staining for GATA3 (g) in lung metastases are shown. (h,i) CD31 immunohistochemical mean intensity (h) and F4/80 immunohistochemical mean intensity (i) in primary 4T1 ± Gata3 tumours. (Values derived from n =8 independent tumours per group, and 10 random fields per tumour.) Representative images are shown below the graphs (*P < 0.05). (j) BALB/c mice were injected i.v. with 4T1 cells ± Gata3. Bioluminescence imaging was performed on day 14 post-injection and mice were euthanized immediately after imaging (n = 10 independent mice per group). (k) GATA3 immunohistochemical staining of 4T1 ± Gata3 experimental i.v. injected lung metastases. (l) BALB/c mice were co-injected i.v. 1:1 with control cells labelled with RFP (4T1-RFP) and Gata3-expressing cells labelled in GFP (4T1-Gata3–GFP). Mice were euthanized on day 12 post-injection and the percentages of RFP- and GFP-positive cells were determined by flow cytometry (n = 12 independent mice per group; **P < 0.002, paired t -test). Data are reported as mean±s.e.m. Scale bars, 200 µm (d,f,g,k) and 100 µm (h,i).
Figure 2
Figure 2
GATA3 induces a more luminal phenotype and suppresses cell migration. (a) Phase-contrast images of MDA231 cells ± GATA3 in 2D culture. (b) Phase-contrast images of MDA231 cells ± GATA3 embedded in 3D Matrigel. (Also see Supplementary Videos S1 and S2.) (c) Relative expression of epithelial markers (CDH1, KRT8, KRT18), mesenchymal markers (FN1, SNAI1, SNAI2, ZEB1, ZEB2, VIM, HMGA2, RANK) and major inflammatory and stemness-associated pathway genes including NF-ΚB (STAT3, RANK), Wnt (FZD1) Hedgehog (Gli3) and Notch (JAG1). (n =8 independently obtained biological samples, *P < 0.05 for all genes.) (df) Flow cytometry analysis of cell-surface markers EpCAM and CD49f in MDA231 cells ± GATA3 (d) and quantification (e) of n = 8 independent experiments, *P < 0.001. A representative histogram of CD49f expression is shown in (f). (*P < 0.01 by probability binning χ2 test.) (g,h) Number of tumour spheres from single MDA231 cells ± GATA3 (*P < 0.02; g), and representative phase-contrast images (h) of n = 3 independent experiments performed in triplicate. Data are reported as mean±s.e.m. All scale bars, 100 µm.
Figure 3
Figure 3
miR-29b is induced by GATA3, enriched in luminal, good prognostic breast cancers, and associated with reduced metastatic potential. (a,b) Eighty-eight miRNAs were screened using qPCR miRNA arrays in MDA231 cells ± GATA3 (a) and miR-29b expression was further validated by TaqMan qPCR (b). (n = 8 independently obtained biological samples, *P < 0.05.) (c) MDA231 cells were co-transfected with an miR-29a/b1–Luc reporter and pcDNA-EGFP (control) or increasing amounts of pcDNA-GATA3. Firefly luciferase was normalized to Renilla luciferase and plotted relative to the control. (n = 5 independent experiments performed in triplicate, *P < 0.05.) (d) MDA231 cells were co-transfected with pcDNA-eGFP or pcDNA- GATA3 and the miR-29a/b1–Luc reporters containing GATA site deletions. The non-mutated (WT) reporter was used as the control. Firefly luciferase was normalized to Renilla luciferase and plotted relative to the control. (n =3 independent experiments performed in triplicate, *P < 0.05.) (e,f) Relative TGF-β–Luc reporter activity (e) and NFκB–Luc reporter activity (f) in MDA231 cells ± GATA3, with and without TGF-β1, sRANKL or TNF-α stimulation. (n =5 independent experiments performed in triplicate, *P < 0.05.) (g,h) Relative miR-29a, miR-29b and miR-29c expression in primary human basal-like, HER2, luminal A and luminal B breast cancers (g), and in primary human oestrogen-receptor (ER)-positive and negative tumours (h). Microarray data set is adapted from ref. . (n = 93 primary breast tumour samples, * Kruskal–Wallis test statistic, P < 0.05.) (i) Relative miR-29a, miR-29b and miR-29c expression in primary mouse basal and luminal breast cancers. Microarray data set is adapted from ref. . (n = 41 primary tumours from individual mice and 5 normal mammary glands, ***P < 0.001.) (j) Relative miR-29b expression in 67NR, 168FARN, 4TO7 and 4T1 cells, with metastatic capability shown below. Microarray data set adapted from ref. . (k) Relative Gata3 and miR-29b expression in primary normal mammary epithelial cells, adenoma and carcinoma cells from MMTV-PyMT mice, with metastatic capability shown below. (n = 6 independently obtained biological samples per group, *P < 0.05.) Data are reported as mean±s.e.m.
Figure 4
Figure 4
miR-29b promotes luminal characteristics and loss of miR-29b induces a de-differentiated, mesenchymal phenotype. (a) Phase-contrast images of PyMT cells ± miR-29b in 2D culture. (b) Relative expression of luminal (Krt8, Esr1 and Gata3) and basal (Krt14) epithelial markers in PyMT cells ± miR-29b by qPCR (n =6 independently obtained biological samples, *P < 0.05 for all genes.) (c) Phase-contrast images of PyMT ± miR-29b aggregates embedded in 3D Matrigel. (d) Phase-contrast images of MDA231 cells ± Zip29 knockdown. (e) Flow cytometry analysis of CD49f (integrin α6) and CD29 (integrin β1) cell-surface expression in MDA231 cells ± Zip29. Representative histograms of n = 5 independent experiments (*P < 0.01 by probability binning χ2 test). (f) Phase-contrast images of HMLE cells ± Zip29. (g) Representative flow cytometry analysis of cell-surface CD24 and CD44 expression of HMLE cells ± Zip29. (n = 5 independent experiments.) (h) Relative expression of epithelial and mesenchymal markers in HMLE cells ± Zip29 by qPCR. (n =6 independently obtained biological samples, *P <0.05.) (i) Western blot analysis of phospho-Smad3, vimentin and actin in HMLE cells ± Zip29. (j) Flow cytometry analysis of the CD44hi/CD24low population in HMLE cells ± Zip29 and ± LY-364947. (n =4 independent experiments, *P < 0.05.) Data are reported as mean±s.e.m. All scale bars, 100 µm. Uncropped images of blots are shown in Supplementary Fig. S9a.
Figure 5
Figure 5
miR-29b targets pro-metastatic genes involved in remodelling the tumour microenvironment and tumour differentiation. (a) Computationally predicted interactions between miR-29b and the 3′ UTRs of several mRNAs involved in differentiation, EMT, angiogenesis, ECM crosslinking and ECM proteolysis. The miR-29b seed sequence is in red and the complementary binding sites are in green. The mutations generated within the 3′ UTRs for c are in purple. (b,c) The wild-type (b) and mutant (c) 3′ UTRs of the indicated miR-29b targets were cloned into dual luciferase reporters and co-transfected with miR-29b or cel-67 control mimic. Renilla luciferase activity was measured 48 h post-transfection and normalized to firefly luciferase (n =5 independent experiments performed in triplicate, *P < 0.05). (d,e) Relative miR-29b expression (d) and mRNA expression of indicated miR-29b targets (e) in stably transduced 4T1 cells ± miR-29b (n =8 independently obtained biological samples, *P < 0.05.) (f,g) Western blot (f) and flow cytometer analysis (g) of 4T1 cells ± miR-29b for ANGPTL4, LOX, VEGF-A and ITGA6 (CD49f). (*P < 0.01 by probability binning χ2 test). Data are reported as mean±s.e.m. Uncropped images of blots are shown in Supplementary Fig. S9b.
Figure 6
Figure 6
miR-29b inhibits lung metastasis and loss of miR-29b increases lung metastasis. (a) BALB/c mice were injected with 4T1 cells ± miR-29b into the mammary fat pad to form primary orthotopic tumours. Tumours were allowed to grow for three weeks and measured (n =8 independent mice per group). (b,c) Representative images of 4T1 ± miR-29b primary orthotopic tumours stained for CD31 to evaluate tumour vasculature (b) or picrosirius red to evaluate fibrillar collagen (c). (d) Representative H&E images of lung metastases from mice injected with primary 4T1 ± miR-29b tumours. (e) BALB/c mice were injected i.v. with 4T1 cells ± miR-29b and bioluminescence imaging was performed on day 14 post-injection. Mice were euthanized immediately after imaging (n = 10 independent mice per group.) Representative H&E images of the lung metastases are shown below. (f) Relative expression of miR-29b targets in primary normal mammary epithelial cells and primary MMTV-PyMT adenoma and carcinoma cells measured by qPCR (n = 6 independently obtained biological samples, *P < 0.05). (g,h) FVB/n mice were injected i.v. with PyMT cells±miR-29b, and euthanized at six weeks. A representative set of gross lungs (g) and H&E images of the lung metastases (h) are shown (n=8 independent mice per group). (i,j) FVB/n mice were injected i.v. with PyMT cells ± Zip29 to knockdown endogenous miR-29b, and bioluminescent imaging was performed on week three (i). The graph depicts the number of surface lung metastases per lung lobe (j; n =8 independent mice per group, *P < 0.05). Data are reported as mean±s.e.m. Scale bars, 100 µm (bd), 200 µm (e), 1 cm (g) and 1mm (h).
Figure 7
Figure 7
miR-29b knockdown increases the level of expression of its target genes and miR-29b suppresses metastasis by repressing four microenvironmental targets. (a) Relative expression of miR-29b targets in Zip29-knockdown cells by qPCR (n = 5 independently obtained biological samples, *P < 0.05). (b) The 3′UTR reporters of the indicated miR-29b targets were co-transfected with anti-miR-29b or control inhibitor into HEK293T cells. (n =3 independent experiments performed in triplicate, *P <0.05.) (c,d) BALB/c mice were injected i.v. with 4T1 cells ± miR-29b re-expressing ANGPTL4, LOX, MMP9 or VEGF-A, and euthanized at two weeks. Representative fluorescence micrographs of lungs were taken on a dissection microscope (c) and GFP fluorescence intensity was quantified (d). (n =8 independent mice per group, *P < 0.01.) Data are reported as mean±s.e.m. Scale bar, 1 mm.
Figure 8
Figure 8
miR-29b is an important downstream target of GATA3 that mediates its ability to promote luminal differentiation and suppress metastasis. (a) Phase-contrast images of MDA231 cells ± GATA3 ± Zip29. (b) Relative expression of miR-29b targets ANGPTL4, LOX, MMP9, PDGFC and VEGFA in MDA231 cells ± GATA3 ± Zip29 by qPCR (n =6 independently obtained biological samples, *P <0.05). (c) The 3′UTR reporters of the indicated miR-29b targets were transfected into MDA231 cells ± GATA3 ± Zip29 and the luciferase activity was measured. (n =3 independent experiments performed in triplicate.) (d) Bioluminescent imaging of mice injected i.v. with MDA231 cells ± GATA3 ± Zip29at four weeks post-injection (n =8 independent mice per group). (e,f) BALB/c mice were injected with 4T1 cells ± Gata3 ± Zip29 into the mammary fat pad. Tumours were allowed to grow for four weeks and lungs were examined for spontaneous metastases (e). Representative H&E images are shown (f). (n =10 independent mice per group, *P < 0.05.) (g,h) BALB/c mice were injected i.v. with 4T1 cells ± Gata3 ± Zip29 knockdown and euthanized two weeks post injection. The number of lung surface metastases was quantified (g) and immunofluorescence staining was performed for E-cadherin (green) and vimentin (red; h; n =8 independent mice per group, **P <0.01). (i) Proposed model of how GATA3 promotes differentiation and suppresses breast cancer metastasis through regulation of miR-29b. Data are reported as mean±s.e.m. Scale bars, 100 µm (a), 200 µm (f) and 50 µm (h).

Comment in

Similar articles

Cited by

References

    1. Hanahan D, Weinberg RA. Hallmarks of cancer: the next generation. Cell. 2011;144:646–674. - PubMed
    1. Valastyan S, Weinberg RA. Tumor metastasis: molecular insights and evolving paradigms. Cell. 2011;147:275–292. - PMC - PubMed
    1. Hanahan D, Coussens LM. Accessories to the crime: functions of cells recruited to the tumor microenvironment. Cancer Cell. 2012;21:309–322. - PubMed
    1. Lu P, Weaver VM, Werb Z. The extracellular matrix: a dynamic niche in cancer progression. J. Cell Biol. 2012;196:395–406. - PMC - PubMed
    1. Yang J, Weinberg RA. Epithelial-mesenchymal transition: at the crossroads of development and tumor metastasis. Dev. Cell. 2008;14:818–829. - PubMed

Publication types

MeSH terms