

Peripheral prepositioning and local CXCL9 chemokine-mediated guidance orchestrate rapid memory CD8+ T cell responses in the lymph node
- PMID: 23352234
- PMCID: PMC3793246
- DOI: 10.1016/j.immuni.2012.11.012
Peripheral prepositioning and local CXCL9 chemokine-mediated guidance orchestrate rapid memory CD8+ T cell responses in the lymph node
Abstract
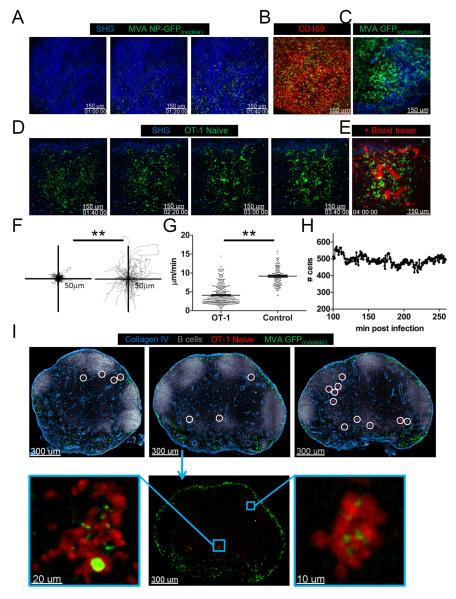
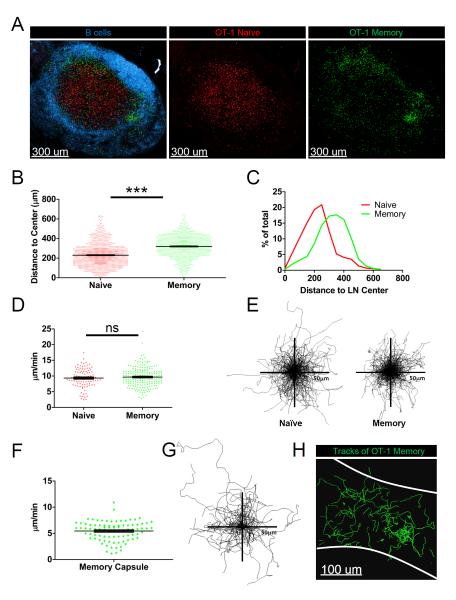
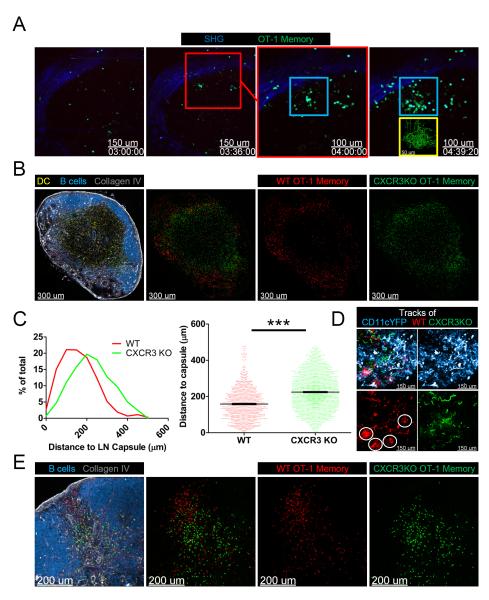
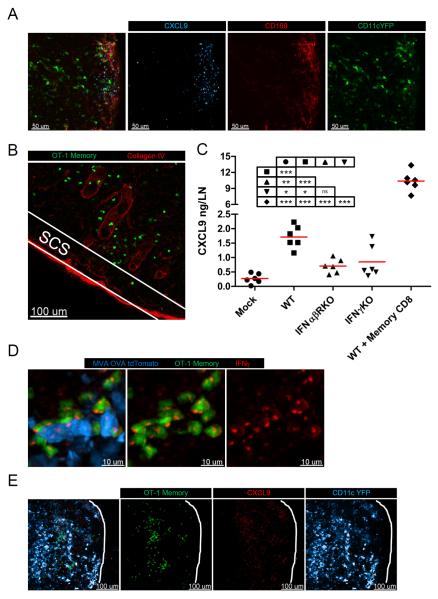
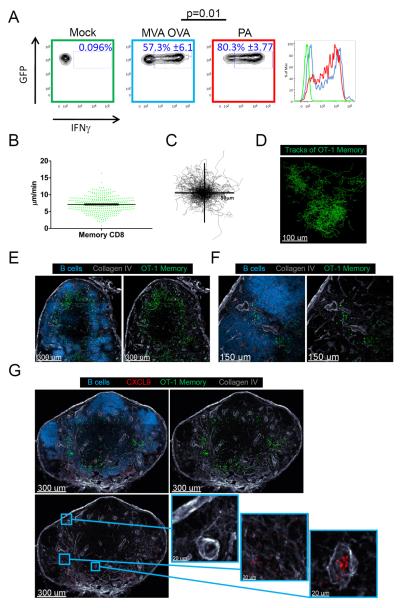
After an infection, the immune system generates long-lived memory lymphocytes whose increased frequency and altered state of differentiation enhance host defense against reinfection. Recently, the spatial distribution of memory cells was found to contribute to their protective function. Effector memory CD8+ T cells reside in peripheral tissue sites of initial pathogen encounter, in apparent anticipation of reinfection. Here we show that within lymph nodes (LNs), memory CD8+ T cells were concentrated near peripheral entry portals of lymph-borne pathogens, promoting rapid engagement of infected sentinel macrophages. A feed-forward CXCL9-dependent circuit provided additional chemotactic cues that further increase local memory cell density. Memory CD8+ T cells also produced effector responses to local cytokine triggers, but their dynamic behavior differed from that seen after antigen recognition. These data reveal the distinct localization and dynamic behavior of naive versus memory T cells within LNs and how these differences contribute to host defense.
Copyright © 2013 Elsevier Inc. All rights reserved.
Figures

Similar articles
-
Effector and stem-like memory cell fates are imprinted in distinct lymph node niches directed by CXCR3 ligands.Nat Immunol. 2021 Apr;22(4):434-448. doi: 10.1038/s41590-021-00878-5. Epub 2021 Mar 1. Nat Immunol. 2021. PMID: 33649580
-
NOD2 regulates CXCR3-dependent CD8+ T cell accumulation in intestinal tissues with acute injury.J Immunol. 2014 Apr 1;192(7):3409-18. doi: 10.4049/jimmunol.1302436. Epub 2014 Mar 3. J Immunol. 2014. PMID: 24591373 Free PMC article.
-
Interferons induce CXCR3-cognate chemokine production by human metastatic melanoma.J Immunother. 2010 Nov-Dec;33(9):965-74. doi: 10.1097/CJI.0b013e3181fb045d. J Immunother. 2010. PMID: 20948440 Free PMC article.
-
Chemokine guidance of central memory T cells is critical for antiviral recall responses in lymph nodes.Cell. 2012 Sep 14;150(6):1249-63. doi: 10.1016/j.cell.2012.08.015. Cell. 2012. PMID: 22980984 Free PMC article.
-
Skin infection generates non-migratory memory CD8+ T(RM) cells providing global skin immunity.Nature. 2012 Feb 29;483(7388):227-31. doi: 10.1038/nature10851. Nature. 2012. PMID: 22388819 Free PMC article.
Cited by
-
Memory CD8(+) T Cells: Innate-Like Sensors and Orchestrators of Protection.Trends Immunol. 2016 Jun;37(6):375-385. doi: 10.1016/j.it.2016.04.001. Epub 2016 Apr 27. Trends Immunol. 2016. PMID: 27131432 Free PMC article. Review.
-
Cross-talk between iNKT cells and CD8 T cells in the spleen requires the IL-4/CCL17 axis for the generation of short-lived effector cells.Proc Natl Acad Sci U S A. 2019 Dec 17;116(51):25816-25827. doi: 10.1073/pnas.1913491116. Epub 2019 Dec 3. Proc Natl Acad Sci U S A. 2019. PMID: 31796596 Free PMC article.
-
The Tumor Immune Microenvironment in Primary CNS Neoplasms: A Review of Current Knowledge and Therapeutic Approaches.Int J Mol Sci. 2023 Jan 19;24(3):2020. doi: 10.3390/ijms24032020. Int J Mol Sci. 2023. PMID: 36768342 Free PMC article. Review.
-
Antigen-specific CD8 T cells in cell cycle circulate in the blood after vaccination.Scand J Immunol. 2019 Feb;89(2):e12735. doi: 10.1111/sji.12735. Epub 2019 Jan 15. Scand J Immunol. 2019. PMID: 30488973 Free PMC article.
-
Multifaceted Roles of Chemokines and Chemokine Receptors in Tumor Immunity.Cancers (Basel). 2021 Dec 6;13(23):6132. doi: 10.3390/cancers13236132. Cancers (Basel). 2021. PMID: 34885241 Free PMC article. Review.
References
-
- Asano K, Nabeyama A, Miyake Y, Qiu CH, Kurita A, Tomura M, Kanagawa O, Fujii S, Tanaka M. CD169-positive macrophages dominate antitumor immunity by crosspresenting dead cell-associated antigens. Immunity. 2011;34:85–95. - PubMed
-
- Ashida H, Ogawa M, Kim M, Mimuro H, Sasakawa C. Bacteria and host interactions in the gut epithelial barrier. Nat Chem Biol. 2012;8:36–45. - PubMed
Publication types
MeSH terms
Substances
Grants and funding
LinkOut - more resources
Full Text Sources
Other Literature Sources
Molecular Biology Databases
Research Materials
