

Protein profiles in Tc1 mice implicate novel pathway perturbations in the Down syndrome brain
- PMID: 23349361
- PMCID: PMC3613160
- DOI: 10.1093/hmg/ddt017
Protein profiles in Tc1 mice implicate novel pathway perturbations in the Down syndrome brain
Abstract
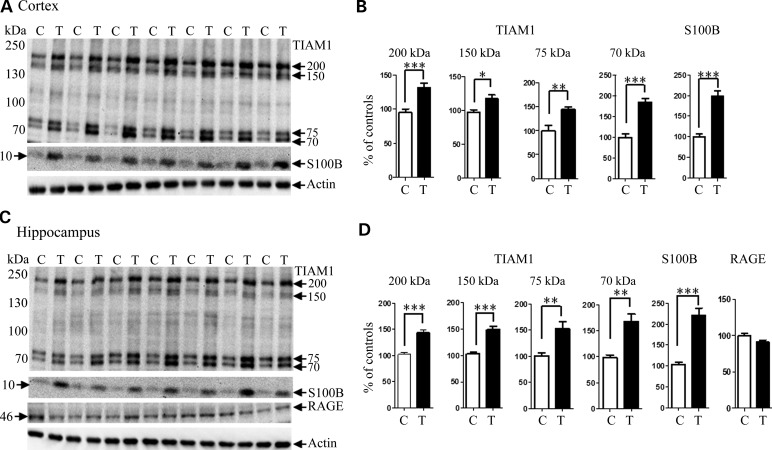
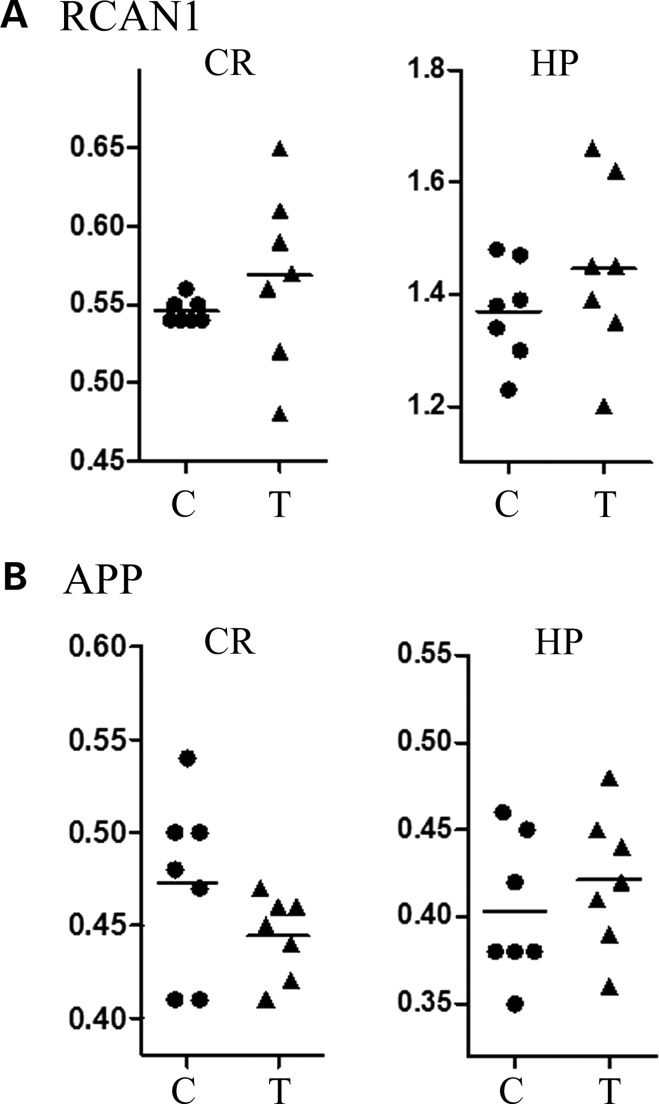
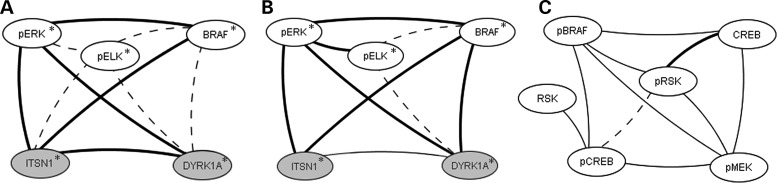
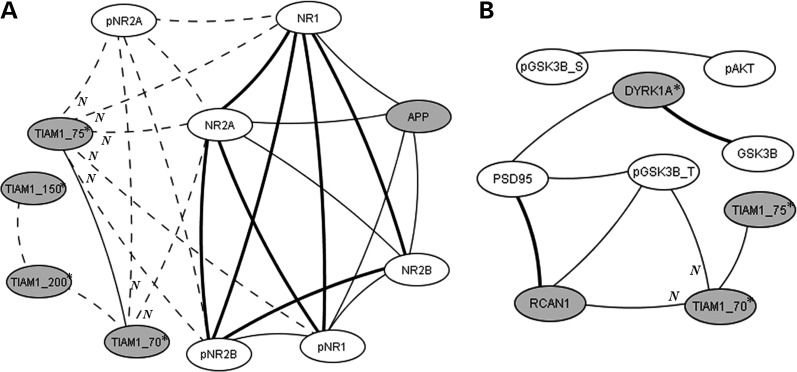
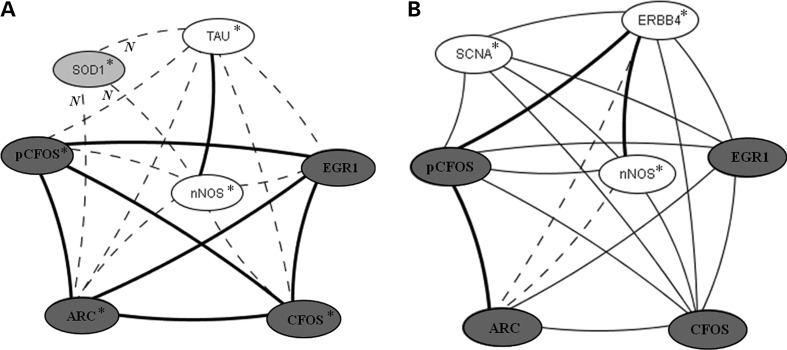
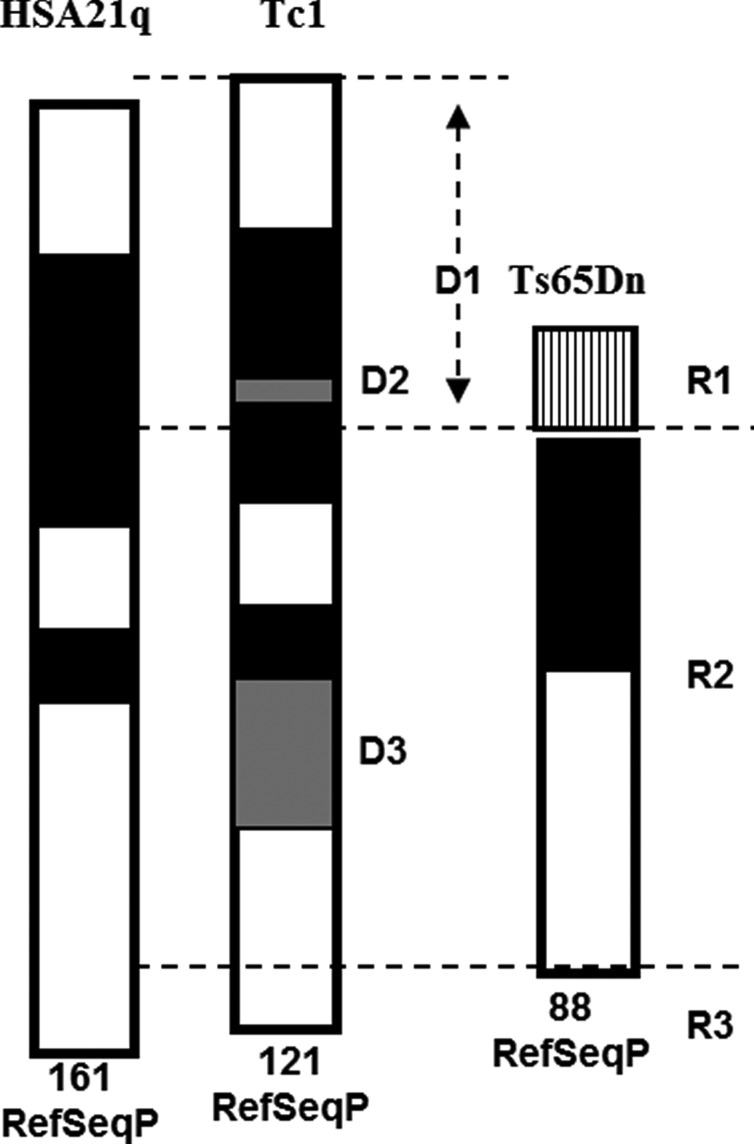
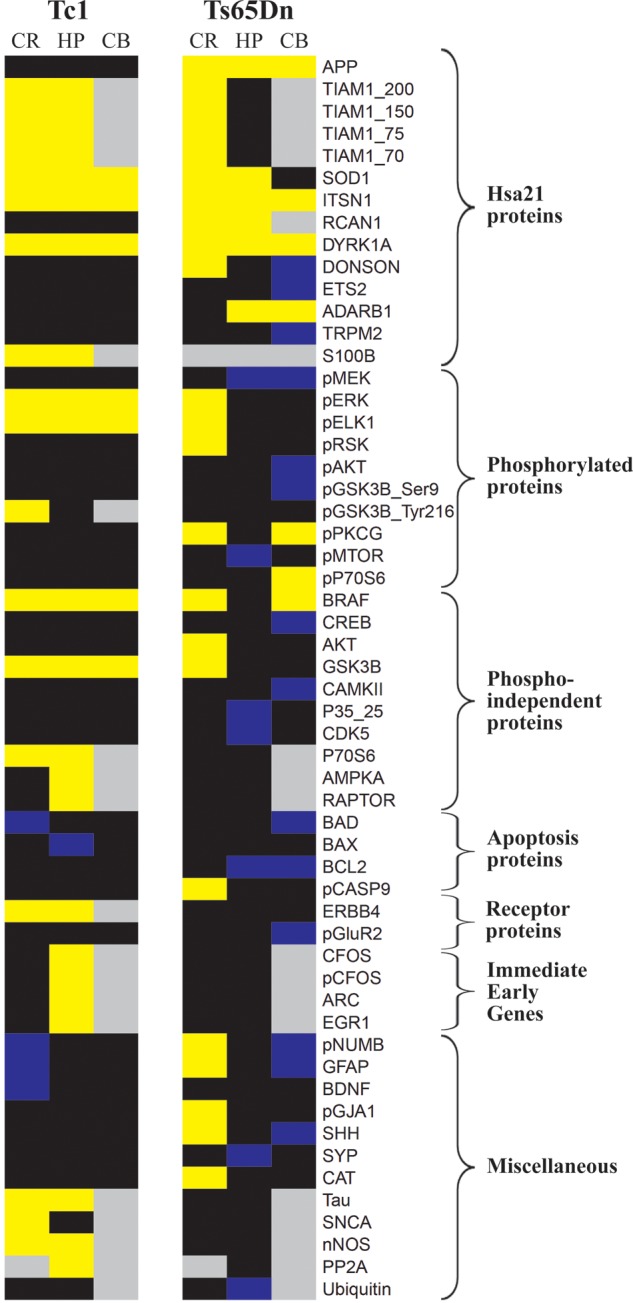
Tc1 mouse model of Down syndrome (DS) is functionally trisomic for ∼120 human chromosome 21 (HSA21) classical protein-coding genes. Tc1 mice display features relevant to the DS phenotype, including abnormalities in learning and memory and synaptic plasticity. To determine the molecular basis for the phenotypic features, the levels of 90 phosphorylation-specific and phosphorylation-independent proteins were measured by Reverse Phase Protein Arrays in hippocampus and cortex, and 64 in cerebellum, of Tc1 mice and littermate controls. Abnormal levels of proteins involved in MAP kinase, mTOR, GSK3B and neuregulin signaling were identified in trisomic mice. In addition, altered correlations among the levels of N-methyl-D-aspartate (NMDA) receptor subunits and the HSA21 proteins amyloid beta (A4) precursor protein (APP) and TIAM1, and between immediate early gene (IEG) proteins and the HSA21 protein superoxide dismutase-1 (SOD1) were found in the hippocampus of Tc1 mice, suggesting altered stoichiometry among these sets of functionally interacting proteins. Protein abnormalities in Tc1 mice were compared with the results of a similar analysis of Ts65Dn mice, a DS mouse model that is trisomic for orthologs of 50 genes trisomic in the Tc1 plus an additional 38 HSA21 orthologs. While there are similarities, abnormalities unique to the Tc1 include increased levels of the S100B calcium-binding protein, mTOR proteins RAPTOR and P70S6, the AMP-kinase catalytic subunit AMPKA, the IEG proteins FBJ murine osteosarcoma viral oncogene homolog (CFOS) and activity-regulated cytoskeleton-associated protein (ARC), and the neuregulin 1 receptor ERBB4. These data identify novel perturbations, relevant to neurological function and to some seen in Alzheimer's disease, that may occur in the DS brain, potentially contributing to phenotypic features and influencing drug responses.
Figures


Similar articles
-
Loss of correlations among proteins in brains of the Ts65Dn mouse model of down syndrome.J Proteome Res. 2012 Feb 3;11(2):1251-63. doi: 10.1021/pr2011582. Epub 2012 Jan 25. J Proteome Res. 2012. PMID: 22214338
-
Protein dynamics associated with failed and rescued learning in the Ts65Dn mouse model of Down syndrome.PLoS One. 2015 Mar 20;10(3):e0119491. doi: 10.1371/journal.pone.0119491. eCollection 2015. PLoS One. 2015. PMID: 25793384 Free PMC article.
-
In vivo and ex vivo analyses of amyloid toxicity in the Tc1 mouse model of Down syndrome.J Psychopharmacol. 2018 Feb;32(2):174-190. doi: 10.1177/0269881117743484. Epub 2017 Dec 7. J Psychopharmacol. 2018. PMID: 29215943 Free PMC article.
-
Mouse models of Down syndrome: gene content and consequences.Mamm Genome. 2016 Dec;27(11-12):538-555. doi: 10.1007/s00335-016-9661-8. Epub 2016 Aug 18. Mamm Genome. 2016. PMID: 27538963 Free PMC article. Review.
-
On the cause of mental retardation in Down syndrome: extrapolation from full and segmental trisomy 16 mouse models.Brain Res Brain Res Rev. 2001 Apr;35(2):115-45. doi: 10.1016/s0926-6410(00)00074-4. Brain Res Brain Res Rev. 2001. PMID: 11336779 Review.
Cited by
-
TIAM-1 differentially regulates dendritic and axonal microtubule organization in patterning neuronal development through its multiple domains.PLoS Genet. 2022 Oct 12;18(10):e1010454. doi: 10.1371/journal.pgen.1010454. eCollection 2022 Oct. PLoS Genet. 2022. PMID: 36223408 Free PMC article.
-
Signalling pathways contributing to learning and memory deficits in the Ts65Dn mouse model of Down syndrome.Neuronal Signal. 2021 Mar 12;5(1):NS20200011. doi: 10.1042/NS20200011. eCollection 2021 Apr. Neuronal Signal. 2021. PMID: 33763235 Free PMC article. Review.
-
Cognitive Impairment, Neuroimaging, and Alzheimer Neuropathology in Mouse Models of Down Syndrome.Curr Alzheimer Res. 2016;13(1):35-52. doi: 10.2174/1567205012666150921095505. Curr Alzheimer Res. 2016. PMID: 26391050 Free PMC article. Review.
-
Rodent models in Down syndrome research: impact and future opportunities.Dis Model Mech. 2017 Oct 1;10(10):1165-1186. doi: 10.1242/dmm.029728. Dis Model Mech. 2017. PMID: 28993310 Free PMC article. Review.
-
The Rac-GEF Tiam1 Promotes Dendrite and Synapse Stabilization of Dentate Granule Cells and Restricts Hippocampal-Dependent Memory Functions.J Neurosci. 2021 Feb 10;41(6):1191-1206. doi: 10.1523/JNEUROSCI.3271-17.2020. Epub 2020 Dec 16. J Neurosci. 2021. PMID: 33328293 Free PMC article.
References
-
- CDC, Centers for Disease Control and Prevention. Improved national prevalence estimates for 18 major birth defects. MMWR Morb. Mortal. Wkly. Rep. 2006;54:6–12. - PubMed
-
- Irving C., Basu A., Richmond S., Burn J., Wren C. Twenty-year trends in prevalence and survival of Down syndrome. Eur. J. Hum. Genet. 2008;16:1336–1340. - PubMed
-
- Chapman R.S., Hesketh L.J. Behavioral phenotype of individuals with Down syndrome. Ment. Retard. Dev. Disabil. Res. Rev. 2000;6:84–95. - PubMed
-
- Silverman W. Down syndrome: cognitive phenotype. Ment. Retard. Dev. Disabil. Res. Rev. 2007;13:228–236. - PubMed
Publication types
MeSH terms
Substances
Grants and funding
LinkOut - more resources
Full Text Sources
Other Literature Sources
Medical
Molecular Biology Databases
Miscellaneous
