

APoc: large-scale identification of similar protein pockets
- PMID: 23335017
- PMCID: PMC3582269
- DOI: 10.1093/bioinformatics/btt024
APoc: large-scale identification of similar protein pockets
Abstract
Motivation: Most proteins interact with small-molecule ligands such as metabolites or drug compounds. Over the past several decades, many of these interactions have been captured in high-resolution atomic structures. From a geometric point of view, most interaction sites for grasping these small-molecule ligands, as revealed in these structures, form concave shapes, or 'pockets', on the protein's surface. An efficient method for comparing these pockets could greatly assist the classification of ligand-binding sites, prediction of protein molecular function and design of novel drug compounds.
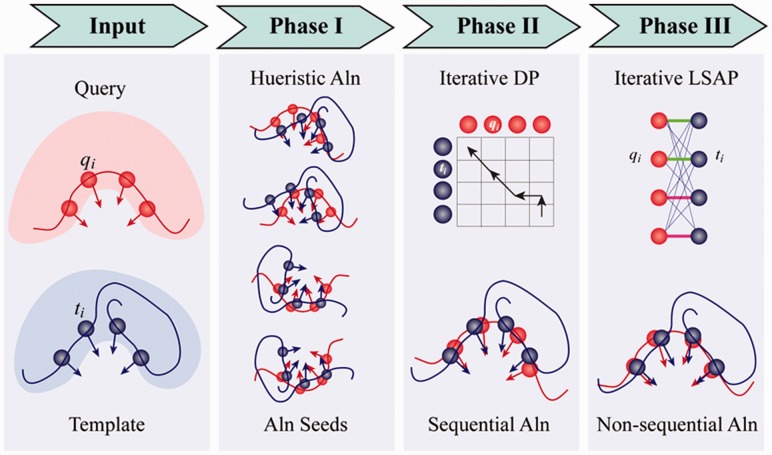
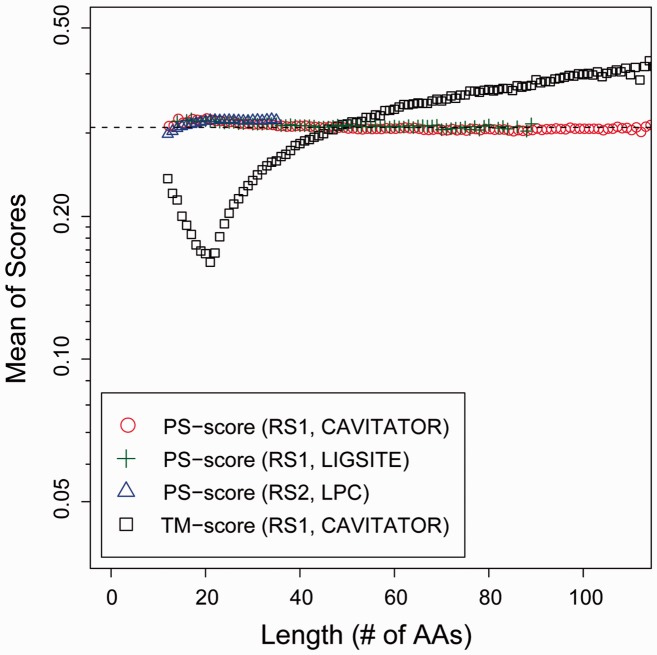
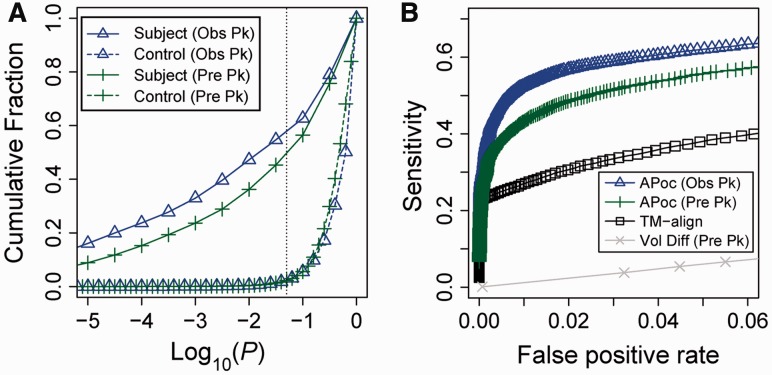
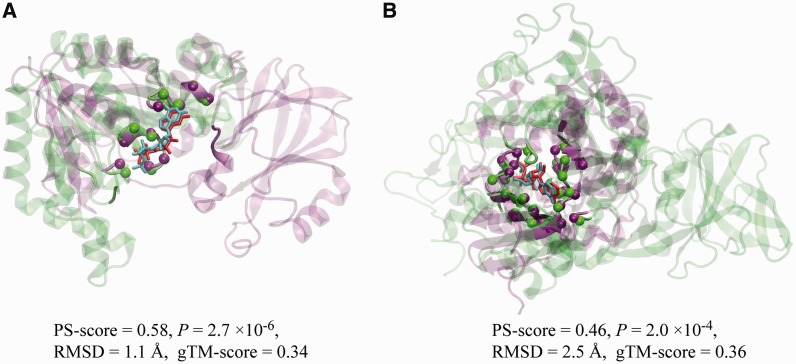
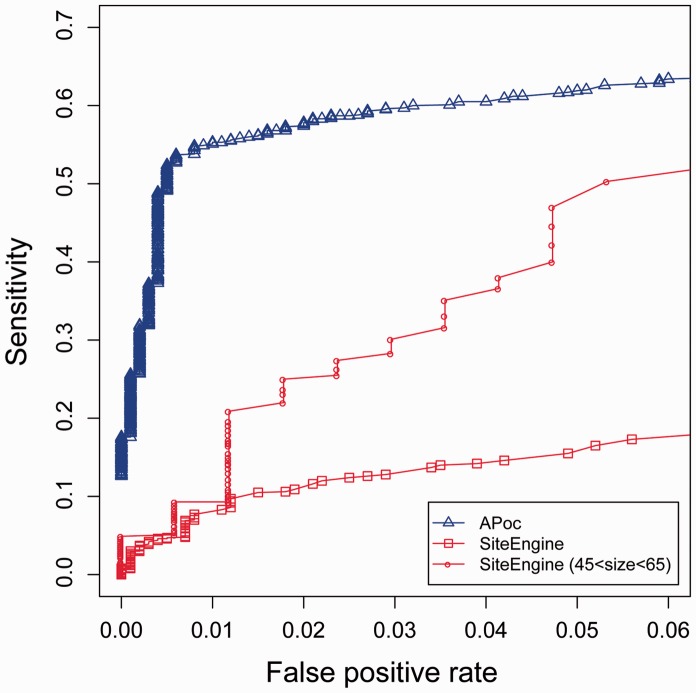
Results: We introduce a computational method, APoc (Alignment of Pockets), for the large-scale, sequence order-independent, structural comparison of protein pockets. A scoring function, the Pocket Similarity Score (PS-score), is derived to measure the level of similarity between pockets. Statistical models are used to estimate the significance of the PS-score based on millions of comparisons of randomly related pockets. APoc is a general robust method that may be applied to pockets identified by various approaches, such as ligand-binding sites as observed in experimental complex structures, or predicted pockets identified by a pocket-detection method. Finally, we curate large benchmark datasets to evaluate the performance of APoc and present interesting examples to demonstrate the usefulness of the method. We also demonstrate that APoc has better performance than the geometric hashing-based method SiteEngine.
Availability and implementation: The APoc software package including the source code is freely available at http://cssb.biology.gatech.edu/APoc.
Figures
Similar articles
-
A new protein binding pocket similarity measure based on comparison of clouds of atoms in 3D: application to ligand prediction.BMC Bioinformatics. 2010 Feb 22;11:99. doi: 10.1186/1471-2105-11-99. BMC Bioinformatics. 2010. PMID: 20175916 Free PMC article.
-
Comparative assessment of strategies to identify similar ligand-binding pockets in proteins.BMC Bioinformatics. 2018 Mar 9;19(1):91. doi: 10.1186/s12859-018-2109-2. BMC Bioinformatics. 2018. PMID: 29523085 Free PMC article.
-
Visualisation of variable binding pockets on protein surfaces by probabilistic analysis of related structure sets.BMC Bioinformatics. 2012 Mar 14;13:39. doi: 10.1186/1471-2105-13-39. BMC Bioinformatics. 2012. PMID: 22417279 Free PMC article.
-
[Development and validation of programs for ligand-binding-pocket search].Yakugaku Zasshi. 2011;131(10):1429-35. doi: 10.1248/yakushi.131.1429. Yakugaku Zasshi. 2011. PMID: 21963969 Review. Japanese.
-
Implications of the small number of distinct ligand binding pockets in proteins for drug discovery, evolution and biochemical function.Bioorg Med Chem Lett. 2015 Mar 15;25(6):1163-70. doi: 10.1016/j.bmcl.2015.01.059. Epub 2015 Feb 3. Bioorg Med Chem Lett. 2015. PMID: 25690787 Free PMC article. Review.
Cited by
-
What Makes GPCRs from Different Families Bind to the Same Ligand?Biomolecules. 2022 Jun 21;12(7):863. doi: 10.3390/biom12070863. Biomolecules. 2022. PMID: 35883418 Free PMC article.
-
Are protein-protein interfaces special regions on a protein's surface?J Chem Phys. 2015 Dec 28;143(24):243149. doi: 10.1063/1.4937428. J Chem Phys. 2015. PMID: 26723634 Free PMC article.
-
MEF-AlloSite: an accurate and robust Multimodel Ensemble Feature selection for the Allosteric Site identification model.J Cheminform. 2024 Oct 23;16(1):116. doi: 10.1186/s13321-024-00882-5. J Cheminform. 2024. PMID: 39444016 Free PMC article.
-
Ligand-Binding-Site Structure Refinement Using Molecular Dynamics with Restraints Derived from Predicted Binding Site Templates.J Chem Theory Comput. 2019 Nov 12;15(11):6524-6535. doi: 10.1021/acs.jctc.9b00751. Epub 2019 Oct 14. J Chem Theory Comput. 2019. PMID: 31557013 Free PMC article.
-
SiteMotif: A graph-based algorithm for deriving structural motifs in Protein Ligand binding sites.PLoS Comput Biol. 2022 Feb 24;18(2):e1009901. doi: 10.1371/journal.pcbi.1009901. eCollection 2022 Feb. PLoS Comput Biol. 2022. PMID: 35202398 Free PMC article.
References
-
- Alberts B. Molecular Biology of the Cell. New York: Garland Science; 2008.
Publication types
MeSH terms
Substances
Grants and funding
LinkOut - more resources
Full Text Sources
Other Literature Sources
Miscellaneous
