

Sirtuin 1-mediated effects of exercise and resveratrol on mitochondrial biogenesis
- PMID: 23329826
- PMCID: PMC3591607
- DOI: 10.1074/jbc.M112.431155
Sirtuin 1-mediated effects of exercise and resveratrol on mitochondrial biogenesis
Abstract
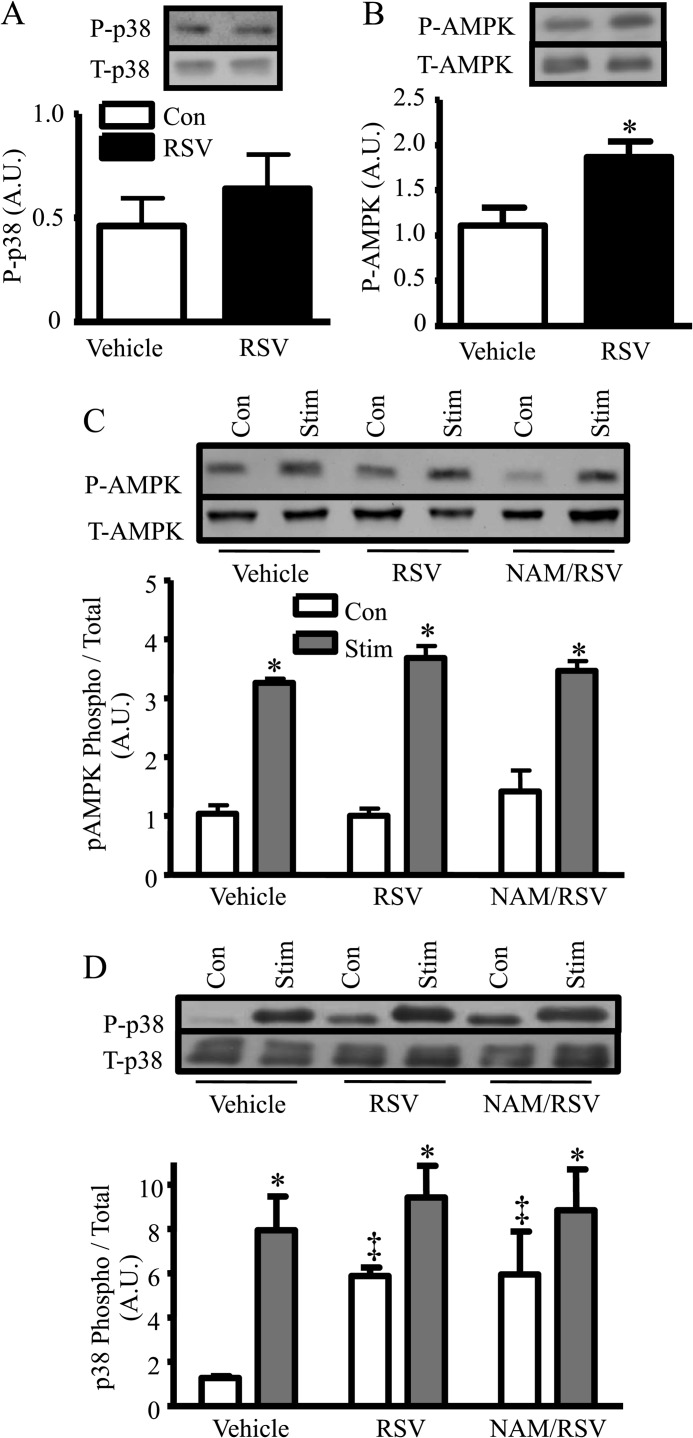
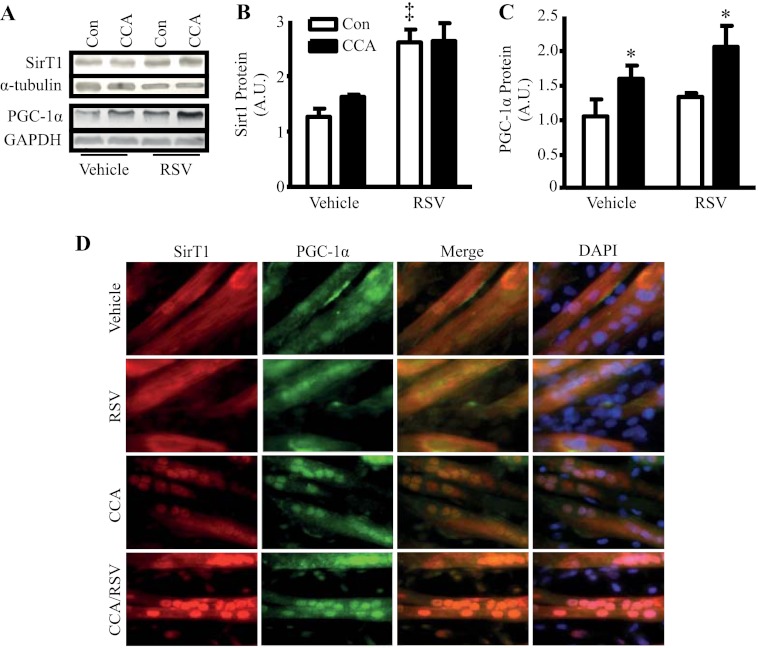
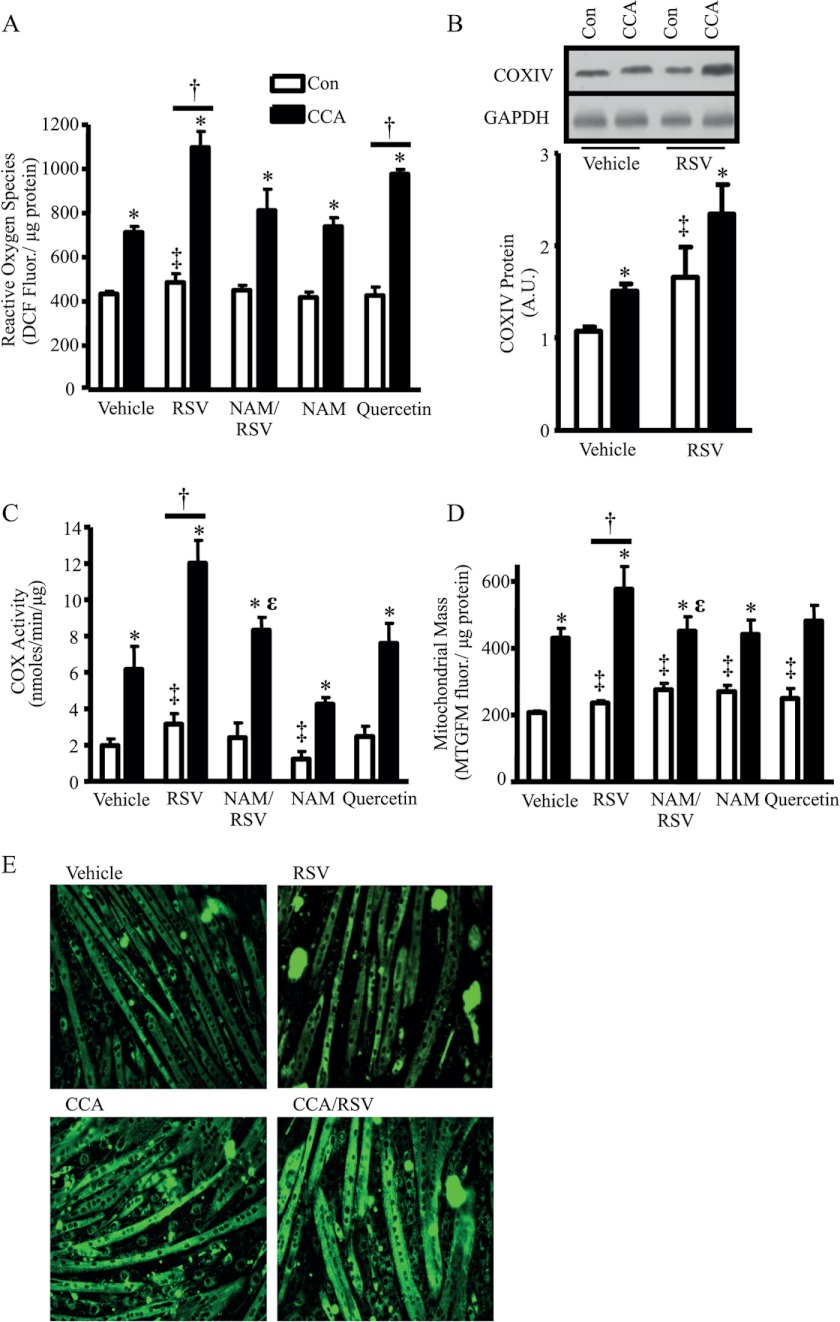
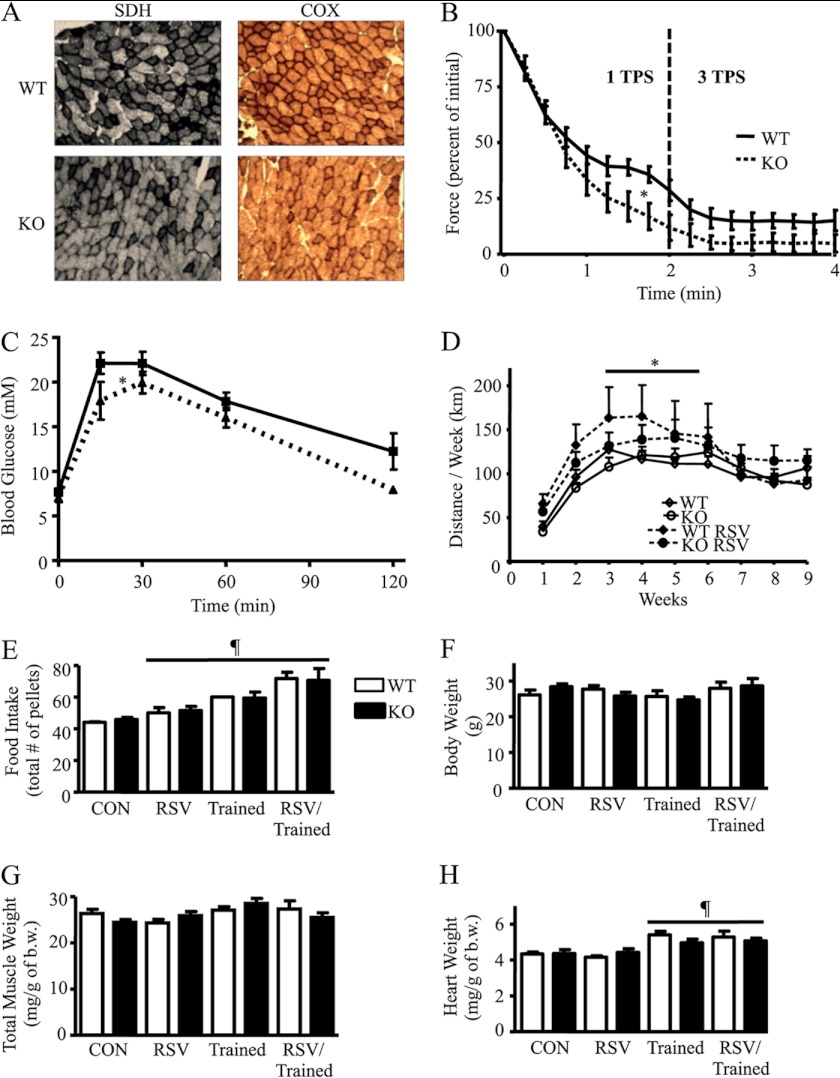
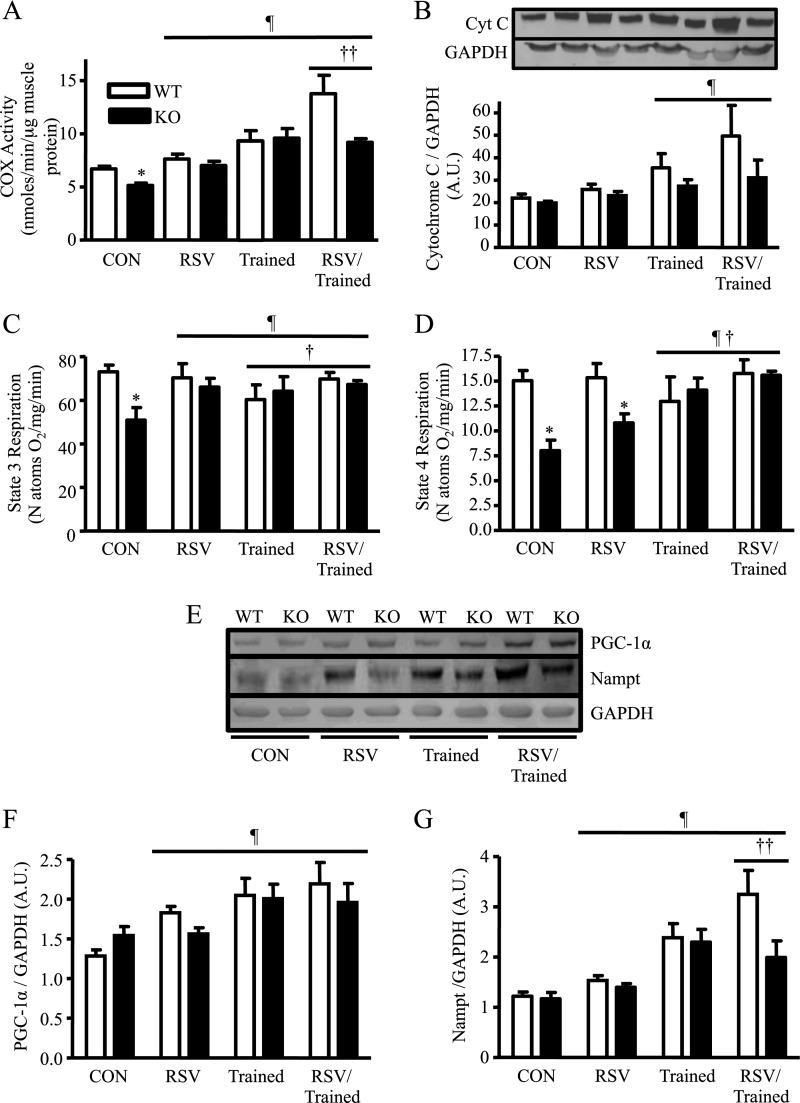
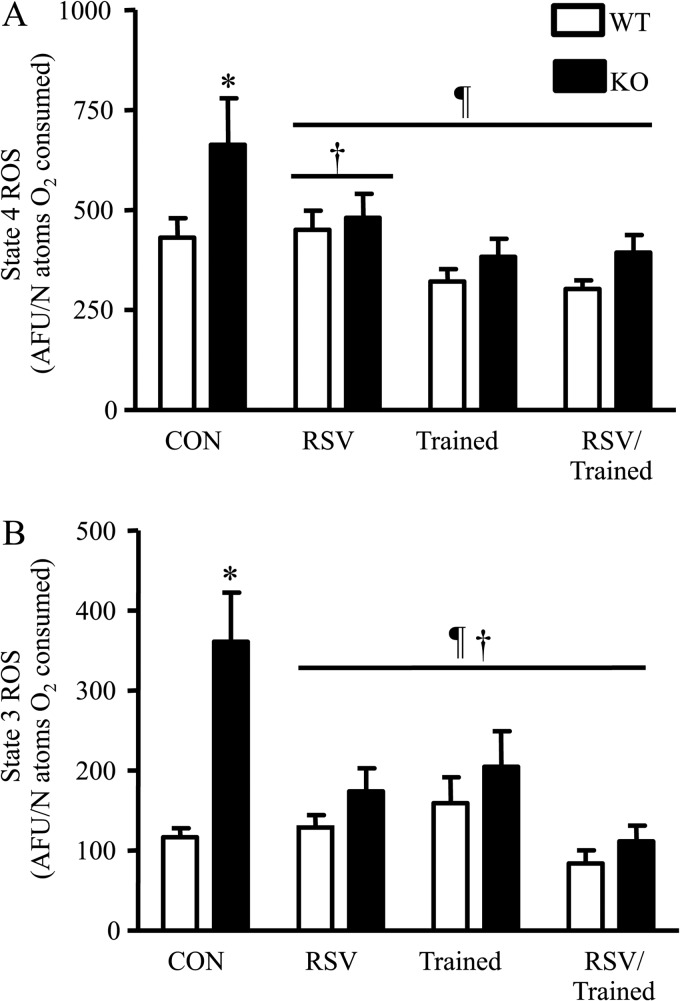
The purpose of this study was to evaluate the role of sirtuin 1 (SirT1) in exercise- and resveratrol (RSV)-induced skeletal muscle mitochondrial biogenesis. Using muscle-specific SirT1-deficient (KO) mice and a cell culture model of differentiated myotubes, we compared the treatment of resveratrol, an activator of SirT1, with that of exercise in inducing mitochondrial biogenesis. These experiments demonstrated that SirT1 plays a modest role in maintaining basal mitochondrial content and a larger role in preserving mitochondrial function. Furthermore, voluntary exercise and RSV treatment induced mitochondrial biogenesis in a SirT1-independent manner. However, when RSV and exercise were combined, a SirT1-dependent synergistic effect was evident, leading to enhanced translocation of PGC-1α and SirT1 to the nucleus and stimulation of mitochondrial biogenesis. Thus, the magnitude of the effect of RSV on muscle mitochondrial biogenesis is reliant on SirT1, as well as the cellular environment, such as that produced by repeated bouts of exercise.
Figures
Similar articles
-
Sirtuin 1 (SIRT1) deacetylase activity is not required for mitochondrial biogenesis or peroxisome proliferator-activated receptor-gamma coactivator-1alpha (PGC-1alpha) deacetylation following endurance exercise.J Biol Chem. 2011 Sep 2;286(35):30561-30570. doi: 10.1074/jbc.M111.261685. Epub 2011 Jul 11. J Biol Chem. 2011. PMID: 21757760 Free PMC article.
-
Effects of resveratrol and SIRT1 on PGC-1α activity and mitochondrial biogenesis: a reevaluation.PLoS Biol. 2013 Jul;11(7):e1001603. doi: 10.1371/journal.pbio.1001603. Epub 2013 Jul 9. PLoS Biol. 2013. PMID: 23874150 Free PMC article.
-
Nuclear SIRT1 activity, but not protein content, regulates mitochondrial biogenesis in rat and human skeletal muscle.Am J Physiol Regul Integr Comp Physiol. 2011 Jul;301(1):R67-75. doi: 10.1152/ajpregu.00417.2010. Epub 2011 May 4. Am J Physiol Regul Integr Comp Physiol. 2011. PMID: 21543634
-
Deacetylation of PGC-1α by SIRT1: importance for skeletal muscle function and exercise-induced mitochondrial biogenesis.Appl Physiol Nutr Metab. 2011 Oct;36(5):589-97. doi: 10.1139/h11-070. Epub 2011 Sep 2. Appl Physiol Nutr Metab. 2011. PMID: 21888529 Review.
-
Unraveling the complexities of SIRT1-mediated mitochondrial regulation in skeletal muscle.Exerc Sport Sci Rev. 2013 Jul;41(3):174-81. doi: 10.1097/JES.0b013e3182956803. Exerc Sport Sci Rev. 2013. PMID: 23792490 Free PMC article. Review.
Cited by
-
Role of PGC-1α during acute exercise-induced autophagy and mitophagy in skeletal muscle.Am J Physiol Cell Physiol. 2015 May 1;308(9):C710-9. doi: 10.1152/ajpcell.00380.2014. Epub 2015 Feb 11. Am J Physiol Cell Physiol. 2015. PMID: 25673772 Free PMC article.
-
Resveratrol as a supplement to exercise training: friend or foe?J Physiol. 2014 Feb 1;592(3):551-2. doi: 10.1113/jphysiol.2013.267922. J Physiol. 2014. PMID: 24488074 Free PMC article. No abstract available.
-
Modulation of tumorigenesis by dietary intervention is not mediated by SIRT1 catalytic activity.PLoS One. 2014 Nov 7;9(11):e112406. doi: 10.1371/journal.pone.0112406. eCollection 2014. PLoS One. 2014. PMID: 25380034 Free PMC article.
-
Protein acetylation in metabolism - metabolites and cofactors.Nat Rev Endocrinol. 2016 Jan;12(1):43-60. doi: 10.1038/nrendo.2015.181. Epub 2015 Oct 27. Nat Rev Endocrinol. 2016. PMID: 26503676 Review.
-
The roles of microRNA in redox metabolism and exercise-mediated adaptation.J Sport Health Sci. 2020 Sep;9(5):405-414. doi: 10.1016/j.jshs.2020.03.004. Epub 2020 Mar 19. J Sport Health Sci. 2020. PMID: 32780693 Free PMC article. Review.
References
-
- Patti M. E., Butte A. J., Crunkhorn S., Cusi K., Berria R., Kashyap S., Miyazaki Y., Kohane I., Costello M., Saccone R., Landaker E. J., Goldfine A. B., Mun E., DeFronzo R., Finlayson J., Kahn C. R., Mandarino L. J. (2003) Coordinated reduction of genes of oxidative metabolism in humans with insulin resistance and diabetes: Potential role of PGC1 and NRF1. Proc. Natl. Acad. Sci. U.S.A. 100, 8466–8471 - PMC - PubMed
-
- Rodgers J. T., Lerin C., Haas W., Gygi S. P., Spiegelman B. M., Puigserver P. (2005) Nutrient control of glucose homeostasis through a complex of PGC-1α and SIRT1. Nature 434, 113–118 - PubMed
-
- Nemoto S., Fergusson M. M., Finkel T. (2005) SIRT1 functionally interacts with the metabolic regulator and transcriptional coactivator PGC-1α. J. Biol. Chem. 280, 16456–16460 - PubMed
Publication types
MeSH terms
Substances
Grants and funding
LinkOut - more resources
Full Text Sources
Other Literature Sources
Molecular Biology Databases
Research Materials
Miscellaneous
