

Hepatic reticuloendothelial system cell iron deposition is associated with increased apoptosis in nonalcoholic fatty liver disease
- PMID: 23325576
- PMCID: PMC3637923
- DOI: 10.1002/hep.26238
Hepatic reticuloendothelial system cell iron deposition is associated with increased apoptosis in nonalcoholic fatty liver disease
Abstract
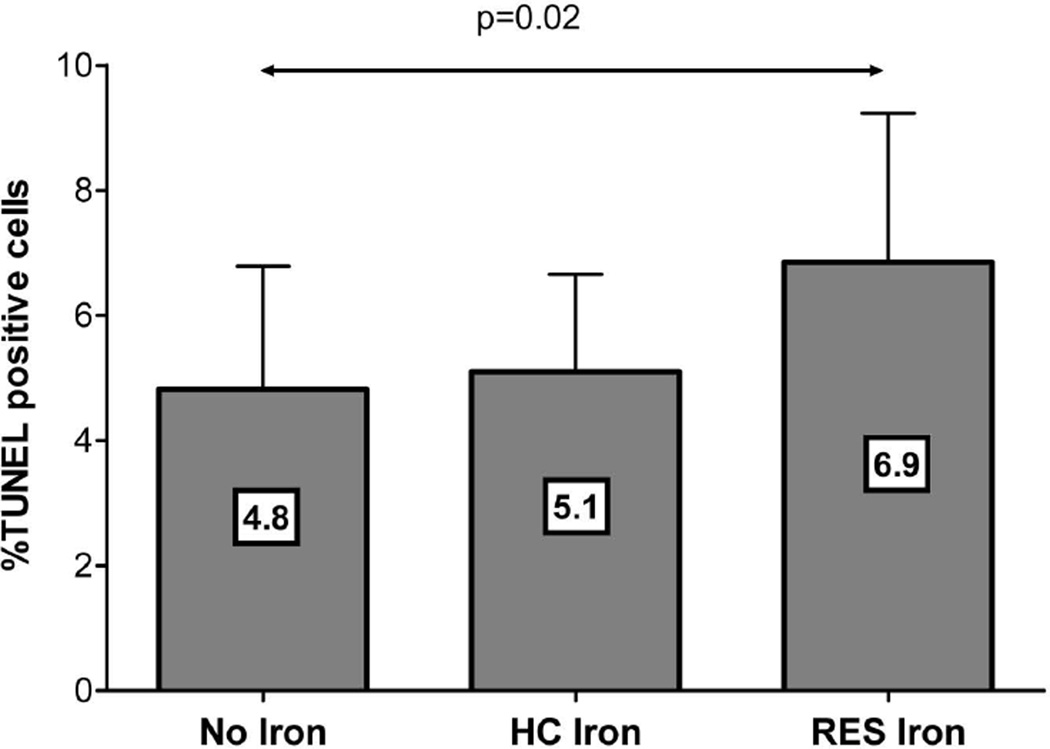
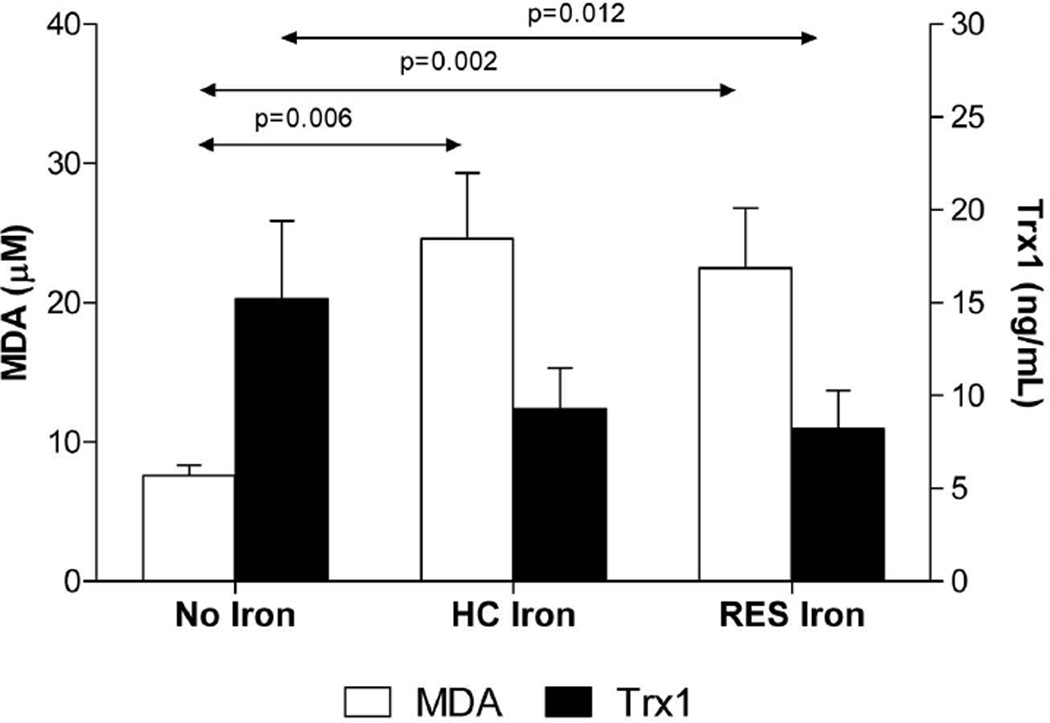
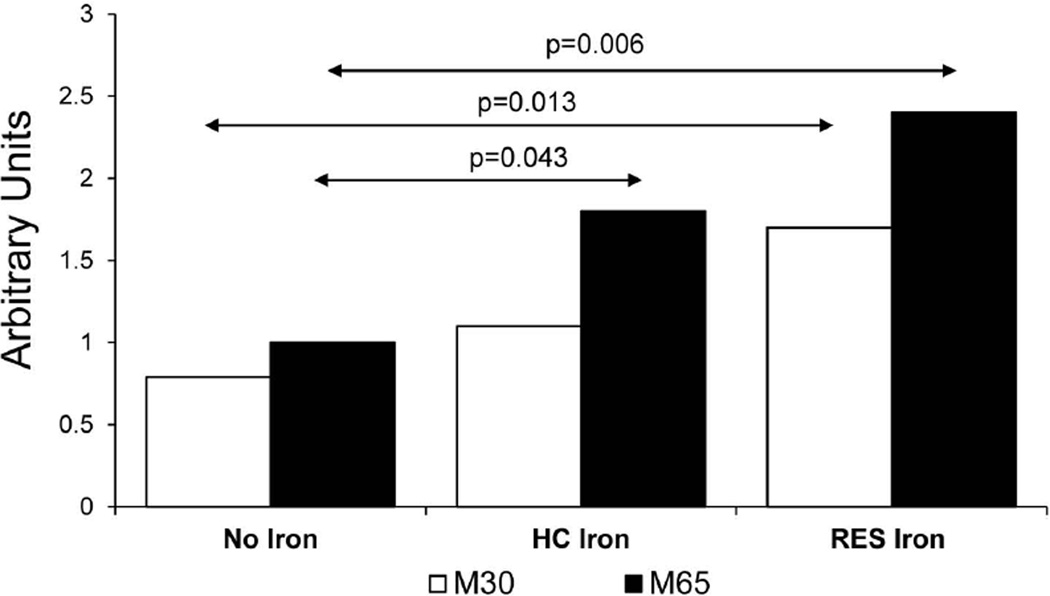
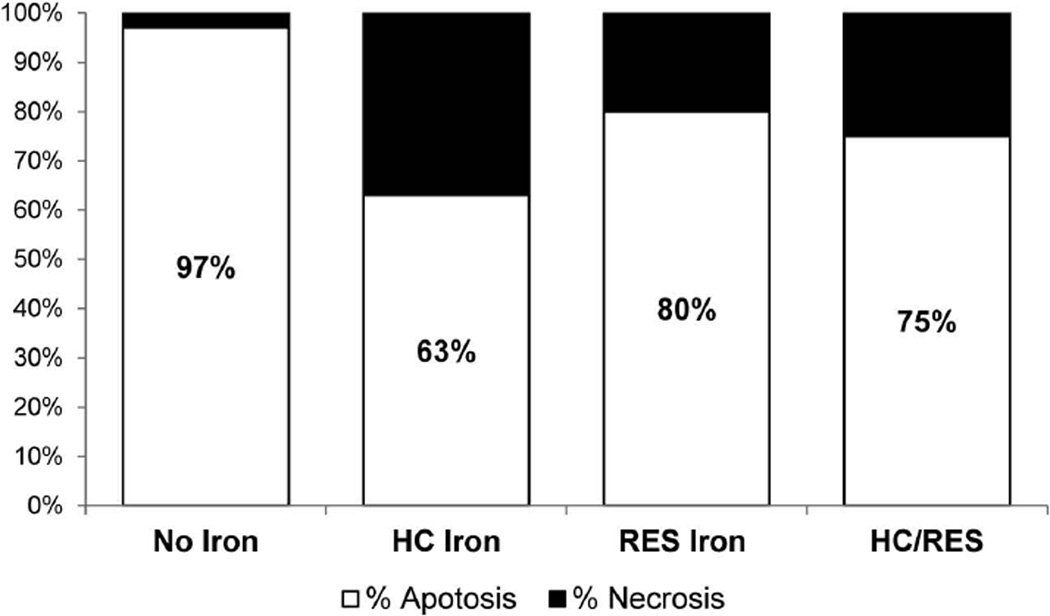
The aim of this study was to examine the relationship between the presence of hepatic iron deposition, apoptosis, histologic features, and serum markers of oxidative stress (OS) and cell death in nonalcoholic fatty liver disease (NAFLD). Clinical, biochemical, metabolic, and independent histopathologic assessment was conducted in 83 unselected patients with biopsy-proven NAFLD from a single center. Apoptosis and necrosis in serum was quantified using serum cytokeratin 18 (CK18) M30 and M65 enzyme-linked immunosorbent assays and in liver by terminal deoxynucleotidyl transferase dUTP nick end labeling (TUNEL) staining in situ. Serum malondialdehyde (MDA) and thioredoxin-1 (Trx1) levels were measured to evaluate OS. Presence of reticuloendothelial system (RES) cell iron in the liver was associated with nonalcoholic steatohepatitis (P < 0.05) and increased hepatic TUNEL staining (P = 0.02), as well as increased serum levels of apoptosis-specific (M30; P = 0.013) and total (M65; P = 0.006) CK18 fragments, higher MDA (P = 0.002) and lower antioxidant Trx1 levels (P = 0.012), compared to patients without stainable hepatic iron. NAFLD patients with a hepatocellular (HC) iron staining pattern also had increased serum MDA (P = 0.006), but not M30 CK18 levels or TUNEL staining, compared to subjects without stainable hepatic iron. Patients with iron deposition limited to hepatocytes had a lower proportion of apoptosis-specific M30 fragments relative to total M65 CK18 levels (37% versus ≤25%; P < 0.05).
Conclusions: Presence of iron in liver RES cells is associated with NASH, increased apoptosis, and increased OS. HC iron deposition in NAFLD is also associated with OS and may promote hepatocyte necrosis in this disease.
Copyright © 2013 American Association for the Study of Liver Diseases.
Conflict of interest statement
Conflicts of interest: None
Figures
Similar articles
-
Lower serum hepcidin and greater parenchymal iron in nonalcoholic fatty liver disease patients with C282Y HFE mutations.Hepatology. 2012 Nov;56(5):1730-40. doi: 10.1002/hep.25856. Epub 2012 Sep 20. Hepatology. 2012. PMID: 22611049 Free PMC article.
-
Relationship between the pattern of hepatic iron deposition and histological severity in nonalcoholic fatty liver disease.Hepatology. 2011 Feb;53(2):448-57. doi: 10.1002/hep.24038. Epub 2010 Nov 29. Hepatology. 2011. PMID: 21274866 Free PMC article.
-
Clinical significance of serum Ck18-M65 and M30 levels in patients with chronic hepatitis B combined with nonalcoholic steatohepatitis and liver fibrosis.Medicine (Baltimore). 2024 Jun 7;103(23):e38342. doi: 10.1097/MD.0000000000038342. Medicine (Baltimore). 2024. PMID: 38847670 Free PMC article.
-
Iron metabolism in Nonalcoholic Fatty Liver Disease.Curr Gastroenterol Rep. 2012 Feb;14(1):8-16. doi: 10.1007/s11894-011-0234-4. Curr Gastroenterol Rep. 2012. PMID: 22124850 Review.
-
Diagnostic Value of CK-18, FGF-21, and Related Biomarker Panel in Nonalcoholic Fatty Liver Disease: A Systematic Review and Meta-Analysis.Biomed Res Int. 2017;2017:9729107. doi: 10.1155/2017/9729107. Epub 2017 Feb 23. Biomed Res Int. 2017. PMID: 28326329 Free PMC article. Review.
Cited by
-
Iron-rich Kupffer cells exhibit phenotypic changes during the development of liver fibrosis in NASH.iScience. 2021 Jan 5;24(2):102032. doi: 10.1016/j.isci.2020.102032. eCollection 2021 Feb 19. iScience. 2021. PMID: 33521599 Free PMC article.
-
Current Status in Testing for Nonalcoholic Fatty Liver Disease (NAFLD) and Nonalcoholic Steatohepatitis (NASH).Cells. 2019 Aug 7;8(8):845. doi: 10.3390/cells8080845. Cells. 2019. PMID: 31394730 Free PMC article. Review.
-
Iron and non-alcoholic fatty liver disease.World J Gastroenterol. 2016 Sep 28;22(36):8112-22. doi: 10.3748/wjg.v22.i36.8112. World J Gastroenterol. 2016. PMID: 27688653 Free PMC article. Review.
-
Serum ferritin as a biomarker for NAFLD: ready for prime time?Hepatol Int. 2019 Mar;13(2):110-112. doi: 10.1007/s12072-019-09934-7. Epub 2019 Feb 9. Hepatol Int. 2019. PMID: 30739262 No abstract available.
-
Apoptosis and non-alcoholic fatty liver diseases.World J Gastroenterol. 2018 Jul 7;24(25):2661-2672. doi: 10.3748/wjg.v24.i25.2661. World J Gastroenterol. 2018. PMID: 29991872 Free PMC article. Review.
References
-
- Tiniakos DG, Vos MB, Brunt EM. Nonalcoholic fatty liver disease: pathology and pathogenesis. Annu Rev Pathol. 2010;5:145–171. - PubMed
-
- Nelson JE, Klintworth H, Kowdley KV. Iron metabolism in Nonalcoholic Fatty Liver Disease. Curr Gastroenterol Rep. 2012;14:8–16. - PubMed
-
- Eaton JW, Qian M. Molecular basis of cellular iron toxicity. Free Radic Biol Med. 2002;32:833–840. - PubMed
-
- Dizdaroglu M, Jaruga P, Birincioglu M, et al. Free radical induceddamage to DNA: mechanisms and measurement. Free RadicBiolMed. 2002;32:1102–1115. - PubMed
Publication types
MeSH terms
Substances
Grants and funding
LinkOut - more resources
Full Text Sources
Other Literature Sources
Medical