. 2013;8(1):e53766.
doi: 10.1371/journal.pone.0053766. Epub 2013 Jan 8.

Vorinostat induces apoptosis and differentiation in myeloid malignancies: genetic and molecular mechanisms

Affiliations

Vorinostat induces apoptosis and differentiation in myeloid malignancies: genetic and molecular mechanisms

Gabriela Silva et al. PLoS One. 2013.

Abstract

Background: Aberrant epigenetic patterns are central in the pathogenesis of haematopoietic diseases such as myelodysplastic syndromes (MDS) and acute myeloid leukaemia (AML). Vorinostat is a HDACi which has produced responses in these disorders. The purpose of this study was to address the functional effects of vorinostat in leukemic cell lines and primary AML and MDS myeloid cells and to dissect the genetic and molecular mechanisms by which it exerts its action.

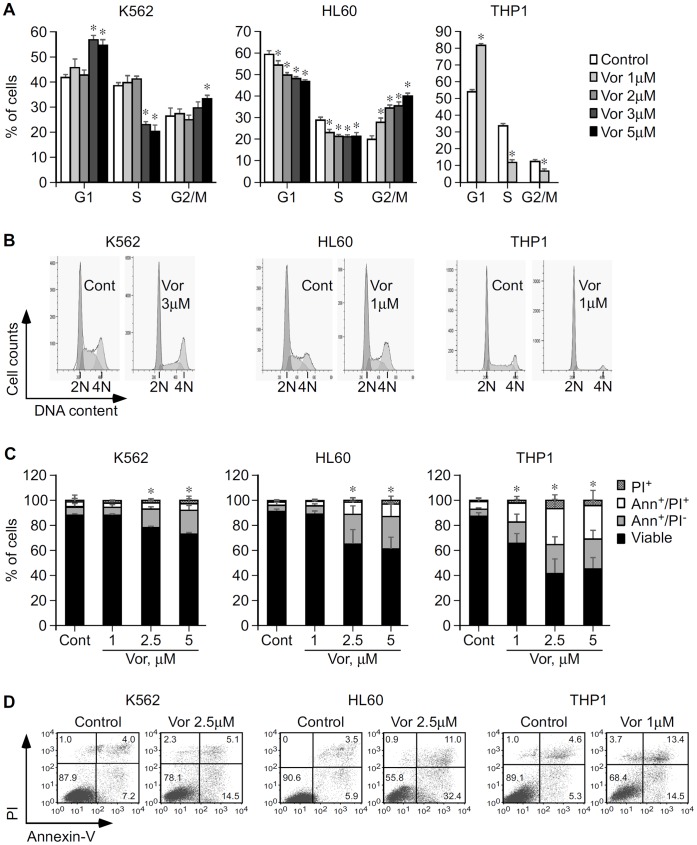
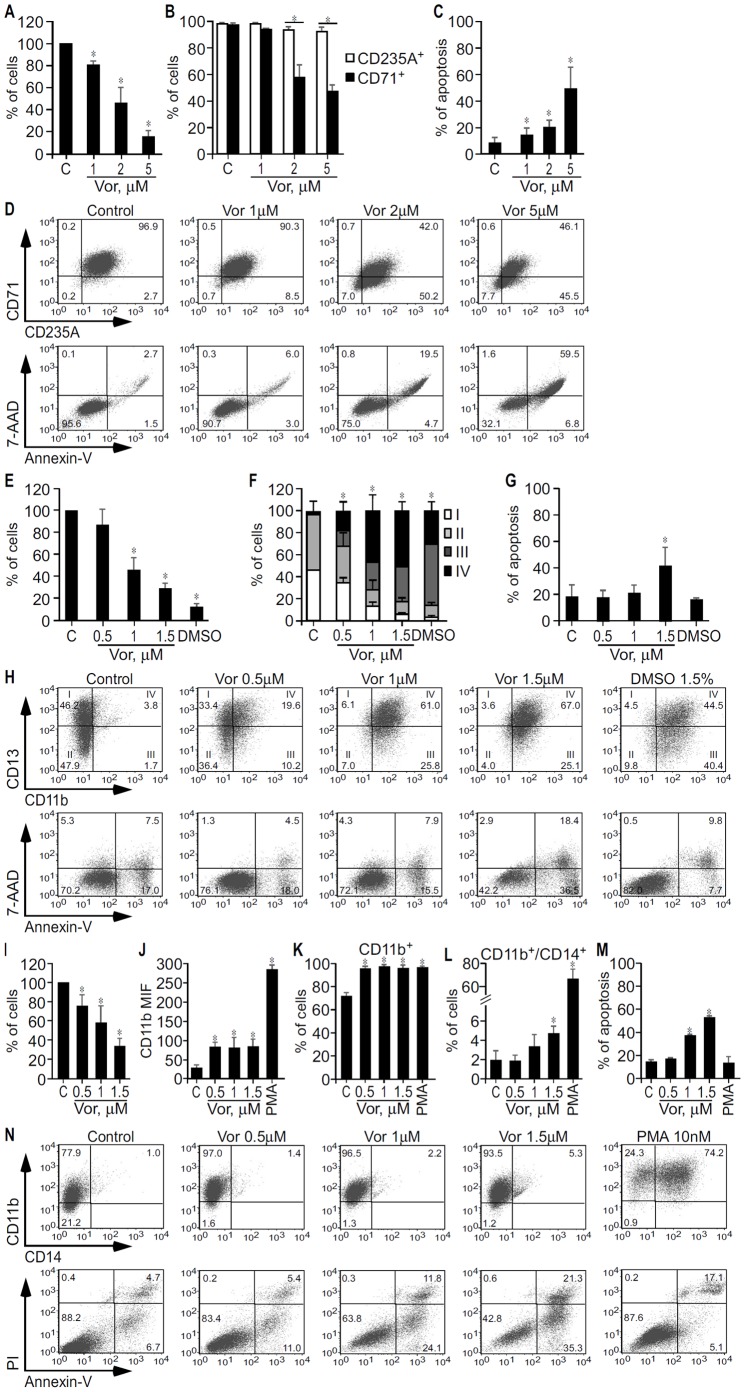
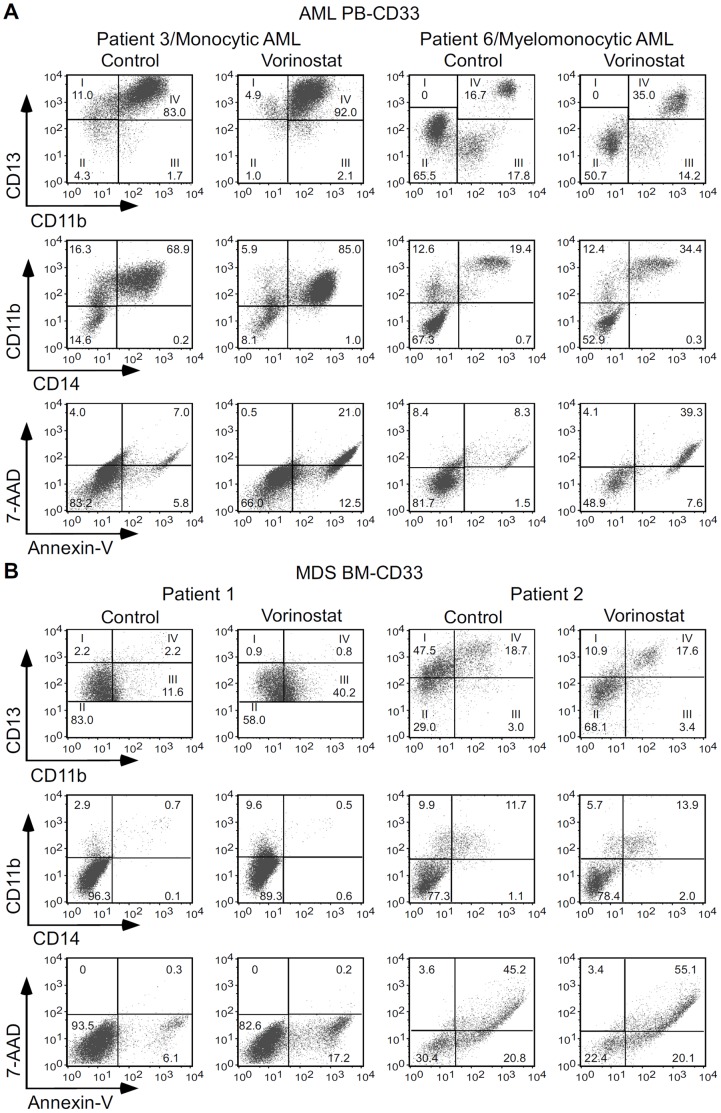
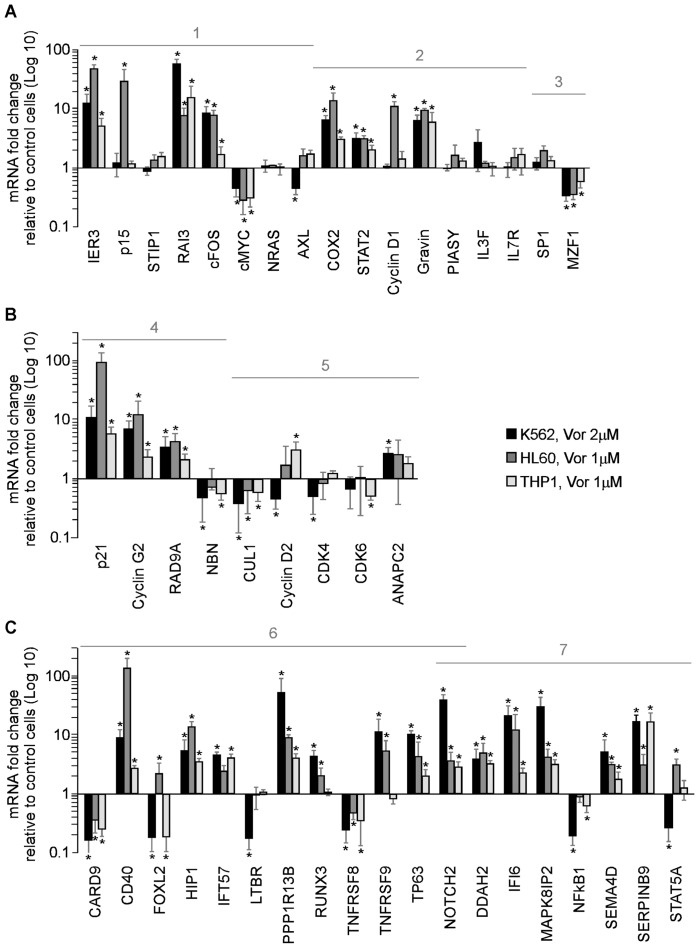
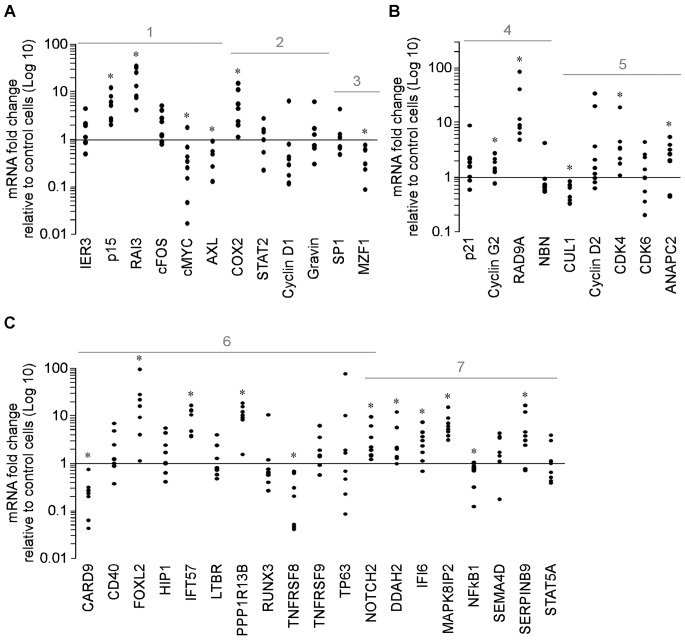
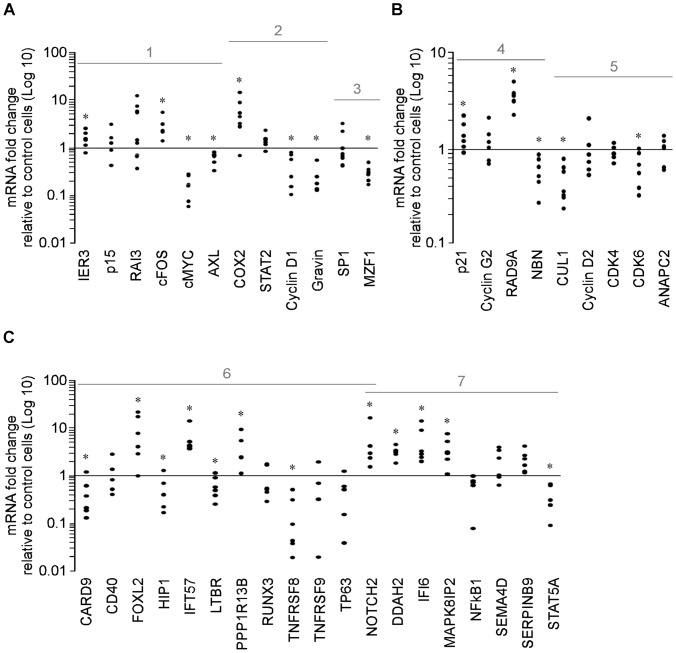
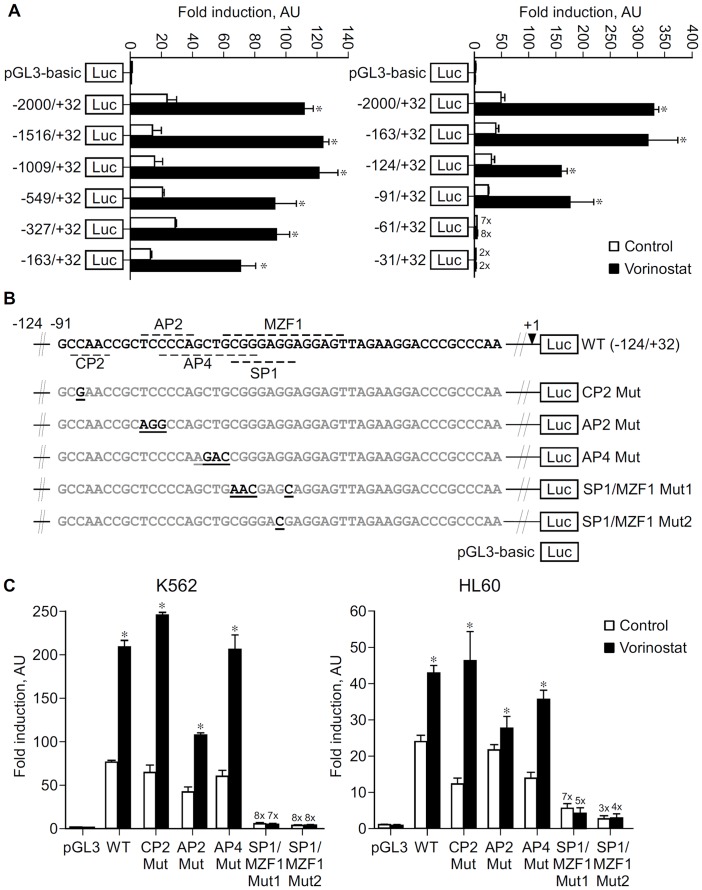
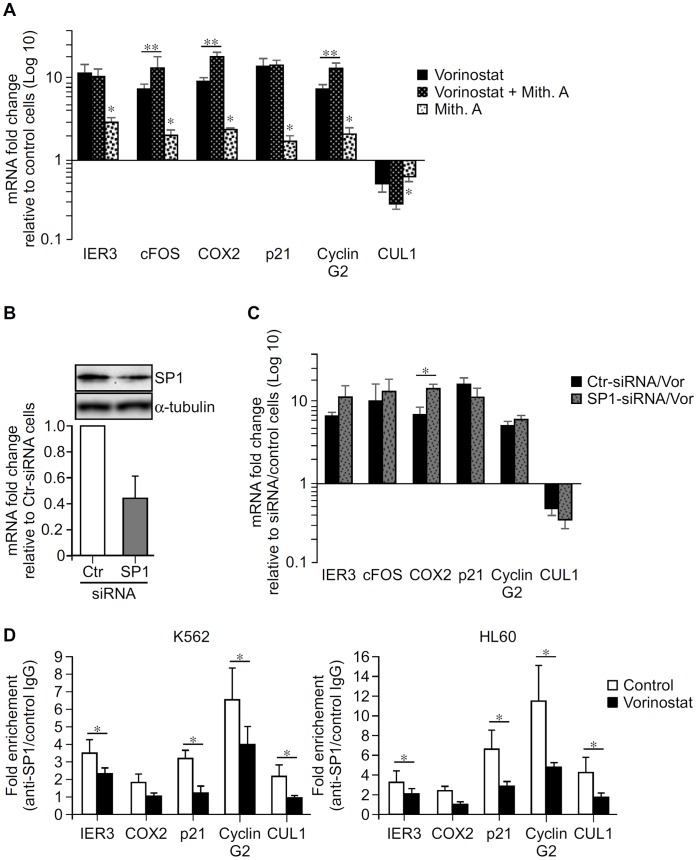
Methodology/principal findings: Functional assays showed vorinostat promoted cell cycle arrest, inhibited growth, and induced apoptosis and differentiation of K562, HL60 and THP-1 and of CD33(+) cells from AML and MDS patients. To explore the genetic mechanism for these effects, we quantified gene expression modulation by vorinostat in these cells. Vorinostat increased expression of genes down-regulated in MDS and/or AML (cFOS, COX2, IER3, p15, RAI3) and suppressed expression of genes over-expressed in these malignancies (AXL, c-MYC, Cyclin D1) and modulated cell cycle and apoptosis genes in a manner which would favor cell cycle arrest, differentiation, and apoptosis of neoplastic cells, consistent with the functional assays. Reporter assays showed transcriptional effect of vorinostat on some of these genes was mediated by proximal promoter elements in GC-rich regions. Vorinostat-modulated expression of some genes was potentiated by mithramycin A, a compound that interferes with SP1 binding to GC-rich DNA sequences, and siRNA-mediated SP1 reduction. ChIP assays revealed vorinostat inhibited DNA binding of SP1 to the proximal promoter regions of these genes. These results suggest vorinostat transcriptional action in some genes is regulated by proximal promoter GC-rich DNA sequences and by SP1.

Conclusion: This study sheds light on the effects of vorinostat in AML and MDS and supports the implementation of clinical trials to explore the use of vorinostat in the treatment of these diseases.


Conflict of interest statement

Competing Interests: Dr AMA receives consulting fees from Celgene and Novartis and is on the board of speakers for Bristol-Meyer Squibb, Shire and Amgen. This does not alter the authors’ adherence to all the PLOS ONE policies on sharing data and materials.

Figures

Figure 1
Figure 1. Functional impact of vorinostat in cell cycle progression and apoptosis of K562, HL60, and THP1 cells.
A, K562, HL60 and THP1 cells were cultured with vorinostat or vehicle (Control/Cont) as indicated and cells were analyzed by flow cytometry after 15 h (K562 and HL60) and 36 h (THP1). Graphs show average percentage of cells in each phase of the cell cycle ± SD of three independent assays for K562 and HL60 and two different experiments for THP1, each in triplicate. B, Representative histograms showing the effect of vorinostat in K562, HL60 and THP1 cell cycle progression. Cells arrested in the G1 phase, 2 N DNA content; cells arrested in S phase; and cells arrested in the G2/M phase (4 N DNA content). C, K562, HL60 and THP1 cells were cultured in the presence of vorinostat or vehicle as indicated and apoptosis was analyzed 48 h thereafter by flow cytometry. Graphs show average percentage of K562, HL60 and THP1 apoptosis ± SD of three independent assays, done in triplicate. D, Representative dot plots showing the percentage of apoptotic K562, HL60 and THP1 cells cultured for 48 h in the absence and in the presence of vorinostat. Numbers are percentages of total cells in the respective gates from one of three independent experiments for each cell line. *p<0.05.
Figure 2
Figure 2. Effect of vorinostat on growth and differentiation of K562, HL60 and THP1 cells.
K562 (A–D), HL60 (E–H) and THP1 (I–N) cells were treated with vorinostat as indicated, vehicle (Control/C), DMSO (1.5%) or PMA (10 nM). After 3 days, K562, HL60 and THP1 cellular growth was determined by trypan blue exclusion method, and surface markers and apoptosis by flow cytometry. A, Average percentage of K562 cells ± SD of four independent experiments, done in duplicate. B, Average percentage of K562 cells expressing the erythroid CD235A marker and the transferin CD71 receptor ± SD of three independent experiments, done in triplicate. C, Average percentage of annexin-V stained apoptotic cells ± SD obtained in the three experiments shown in (B). D, Representative dot blots showing the expression profile of CD235A and CD71 markers and apoptosis in K562 cells treated with vehicle and increasing concentrations of vorinostat. E, Average percentage of HL60 cells ± SD of four independent experiments, done in duplicate. F, Average percentage of HL60 cells on different myeloid maturation stages according the CD13/CD11b expression profile ± SD of four independent experiments, done in triplicate. I (CD13hi/CD11b): myeloblasts; II (CD13lo/int/CD11b): promyelocytes; III (CD13lo/int/CD11b+): myelocytes and metamyelocytes; and IV (CD13hi/CD11b+): band cells and mature neutrophils. G, Average percentage of annexin-V stained apoptotic cells ± SD obtained in the four experiments shown in (F). H, Representative dot blots showing the expression profile of CD11b and CD13 antigens and apoptosis in HL60 treated with vehicle, vorinostat, and DMSO. Numbers in CD13/CD11b plots are percentage of CD33 cells on different myeloid maturation stages. Numbers in other panels are percentages of total cells in the respective gates. I, Average percentage of THP1 cells ± SD of three independent experiments, done in duplicate or triplicate. J, Median fluorescent intensity of CD11b monocytic differentiation marker expressed on the cell surface of THP1 cells. K, Percentage of THP1 cells expressing CD11b. L, Percentage of THP1 cells double positive for CD11b and CD14. Values in (J, K and L) are average values ± SD of three independent experiments, each done in triplicate. M, Average percentage of annexin-V stained apoptotic cells ± SD obtained in the three experiments shown in (J, K and L). N, Representative dot blots showing the expression profile of CD11b and CD14 markers and apoptosis in THP1 cells treated with vehicle, vorinostat and PMA. *, p<0.05.
Figure 3
Figure 3. Effect of vorinostat on myeloid differentiation and apoptosis of CD33+ cells from AML and AML patients.
CD33+ cells from peripheral blood of AML patients (A) and bone marrows of MDS patients (B) were cultured in complete IMDM medium with SCF, IL-3, IL-6, GM-CSF, G-CSF, and EPO in the presence of 1 µM vorinostat or vehicle (Control). After 3 days, myelomonocytic markers, CD11b, CD13 and CD14 and apoptosis were analyzed by flow cytometry. The numbers in CD13/CD11b panels are percentage of CD33 cells on different myeloid maturation stages according the CD13 and CD11b expression levels. I (CD13hi/CD11b): myeloblasts; II (CD13lo/int/CD11b): promyelocytes; III (CD13lo/int/CD11b+): myelocytes and metamyelocytes; and IV (CD13hi/CD11b+): band cells and mature neutrophils. Mature monocytes are also CD13hi/CD11b+. Numbers in other panels are percentages of total cells in the respective gates.
Figure 4
Figure 4. Effect of vorinostat on genes involved in regulation of cell cycle control, proliferation, apoptosis, and differentiation in K562, HL60 and THP1 cells.
K562 HL60, and THP1 cells were treated with vorinostat as indicated or vehicle (Control) for 4 h and gene expression quantified by qPCR. A, Effect of vorinostat on the expression of: 1- genes with altered expression in haematologic malignancies; 2- genes with altered expression in haematologic malignancies known to respond to epigenetic therapy; 3- transcription factors. B, Effect of vorinostat on the expression of genes that control: 4- cell cycle arrest/check point/DNA repair and 5- cell cycle transition. C, Vorinostat effect on the expression of: 6- pro-apoptotic and 7-anti-apoptotic genes. Results are represented as average values ± SD from at least four independent assays, performed in triplicate, for both cell lines. *p<0.05.
Figure 5
Figure 5. Effect of vorinostat on genes involved in regulation of cell cycle control, proliferation, apoptosis, and differentiation in CD33 myeloid cells from AML patients.
PB-CD33 cells from AML patients were treated with 5 µM vorinostat or vehicle (Control) for 8 h and gene expression quantified by qPCR. A, Effect of vorinostat on the expression of genes responsive to vorinostat in K562, HL60 and THP1 cells; 1- genes with altered expression in haematologic malignancies; 2- genes with altered expression in haematologic malignancies that respond to epigenetic therapy; and 3- transcription factors. B, Effect of vorinostat on the expression of genes that control: 4- cell cycle arrest/check point/DNA repair and 5- cell cycle transition. C, Effect of vorinostat on the expression of: 6- pro-apoptotic and 7-anti-apoptotic genes. In all panels, each dot represents data from one patient. *p<0.05.
Figure 6
Figure 6. Effect of vorinostat on genes involved in regulation of cell cycle control, proliferation, apoptosis, and differentiation in CD33 myeloid cells from MDS patients.
BM-CD33 cells from MDS patients were treated with 5 µM vorinostat or vehicle (Control) for 8 h and gene expression quantified by qPCR. A, Effect of vorinostat on the expression of genes responsive to vorinostat in K562, HL60 and THP1; 1- genes with altered expression in haematologic malignancies; 2- genes with altered expression in haematologic malignancies that respond to epigenetic therapy; and 3- transcription factors. B, Effect of vorinostat on the expression of genes that control: 4- cell cycle arrest/check point/DNA repair and 5- cell cycle transition. C, Effect of vorinostat on the expression of: 6- pro-apoptotic and 7-anti-apoptotic genes. In all panels, each dot represents data from one patient. *p<0.05.
Figure 7
Figure 7. Identification of vorinostat responsive elements in the IER3 promoter.
A, K562 cells were transfected with pGL3-basic vector or a series of IER3 reporters as indicated plus β-galactosidase vector, and then treated with vorinostat (2 µM) or vehicle (Control) for 24 h and reporter activity measured. Results are shown as average fold luciferase/β-galactosidase induction versus control cells transfected with pGL3 ± S.D. from one representative of at least three independent assays done in triplicate using each reporter construct at least from two different clones. B, Scheme of wild type and mutated −124/+32 reporter constructs showing the −91 to −43 nucleotide sequence of IER3 promoter containing the putative TF binding sites present in the −91/−61 region (lane 1) and the mutated nucleotides for the different TF binding sites present in this region (lanes 2 to 6). The mutated nucleotides present in the mutant luciferase reporter plasmids for the different TF binding sites are boldfaced and underlined. +1, denotes transcription start site. C, K562 and HL60 cells were transfected with pGL3-basic vector or with wild type and mutated −124/+32 IER3 reporter constructs for the indicated TF plus β-galactosidase vector and the rest of the procedure was done as in (A).The results are average fold luciferase/β-galactosidase induction versus control cells transfected with pGL3 ± S.D. from one representative assay done in triplicate using mutated plasmids for the same putative TF binding site from different clones, of at least three independent assays performed in both K562 and HL60 cells. Data were analyzed using the ANOVA and the Tukey-Kramer multiple comparison test. *p<0.05.
Figure 8
Figure 8. Effect of GC-rich DNA sequences and SP1 on the transcriptional effect of vorinostat on IER3, cFOX, COX2, p21, Cyclin G2 and CUL1 genes.
A, K562 cells were exposed to Mith.A (100 nM) or vehicle (Control) and not further treated or exposed 30 min later to 5 µM vorinostat for 8 h and gene expression quantified by qPCR. Results are average values ± SEM of at least three independent assays, done in triplicate. B–C, K562 cells were transfected with control (Ctr) or SP1 siRNA and treated with vehicle or vorinostat (2 µM) for 24 and 48 h. B upper panel, immunoblot showing SP1 protein levels in cells transfected with control (Ctr) and SP1 siRNAs in 1 out of 5 assays at 48 h after transfection. B lower panel, SP1 mRNA levels in cells transfected with control (Ctr) and SP1 siRNAs. Graph shows average percentage of SP1 mRNA ± S.D. from 5 independent assays at 24 h after transfection. C, Graph shows average mRNA fold change of the indicated genes over vehicle treated cells transfected with the same siRNA 48 h after transfection ± SEM from 3 independent experiments. D, K562 and HL60 cells were treated with vorinostat (5 µM) or vehicle (Control) for 7 h and SP1 binding to the proximal promoter regions of the indicated genes determined by ChIP assays and qPCR. Results are expressed as fold change over control IgG and represent average values of at least three independent experiments ± SEM. Data were analyzed using paired Student’s t test. *p<0.05. **p<0.05.

Similar articles

Cited by

References

    1. Orkin SH, Zon LI (2008) Hematopoiesis: an evolving paradigm for stem cell biology. Cell 132: 631–644. - PMC - PubMed
    1. Stintzing S, Kemmerling R, Kiesslich T, Alinger B, Ocker M, et al. Myelodysplastic syndrome and histone deacetylase inhibitors: “to be or not to be acetylated”? J Biomed Biotechnol 2011: 214143. - PMC - PubMed
    1. Plass C, Oakes C, Blum W, Marcucci G (2008) Epigenetics in acute myeloid leukemia. Semin Oncol 35: 378–387. - PMC - PubMed
    1. Tsiftsoglou AS, Bonovolias ID, Tsiftsoglou SA (2009) Multilevel targeting of hematopoietic stem cell self-renewal, differentiation and apoptosis for leukemia therapy. Pharmacol Ther 122: 264–280. - PubMed
    1. Griffiths EA, Gore SD (2008) DNA methyltransferase and histone deacetylase inhibitors in the treatment of myelodysplastic syndromes. Semin Hematol 45: 23–30. - PMC - PubMed

Publication types

MeSH terms

Grants and funding

This study was funded by a research grant from the Portuguese Association Against Leukemia, from the IPOLFG Oncology Research Fund, and a post-doctoral fellowship from “Fundação para a Ciência e Tecnologia” (SFRH/BPD/46494/2008) for GS. The funders had no role in study design, data collection and analysis, decision to publish, or preparation of the manuscript.