. 2013 Mar 1;41(5):3032-46.
doi: 10.1093/nar/gks1470. Epub 2013 Jan 11.

MSH6- or PMS2-deficiency causes re-replication in DT40 B cells, but it has little effect on immunoglobulin gene conversion or on repair of AID-generated uracils

Affiliations

MSH6- or PMS2-deficiency causes re-replication in DT40 B cells, but it has little effect on immunoglobulin gene conversion or on repair of AID-generated uracils

Vanina A Campo et al. Nucleic Acids Res. .

Abstract

The mammalian antibody repertoire is shaped by somatic hypermutation (SHM) and class switch recombination (CSR) of the immunoglobulin (Ig) loci of B lymphocytes. SHM and CSR are triggered by non-canonical, error-prone processing of G/U mismatches generated by activation-induced deaminase (AID). In birds, AID does not trigger SHM, but it triggers Ig gene conversion (GC), a 'homeologous' recombination process involving the Ig variable region and proximal pseudogenes. Because recombination fidelity is controlled by the mismatch repair (MMR) system, we investigated whether MMR affects GC in the chicken B cell line DT40. We show here that Msh6(-/-) and Pms2(-/-) DT40 cells display cell cycle defects, including genomic re-replication. However, although IgVλ GC tracts in MMR-deficient cells were slightly longer than in normal cells, Ig GC frequency, donor choice or the number of mutations per sequence remained unaltered. The finding that the avian MMR system, unlike that of mammals, does not seem to contribute towards the processing of G/U mismatches in vitro could explain why MMR is unable to initiate Ig GC in this species, despite initiating SHM and CSR in mammalian cells. Moreover, as MMR does not counteract or govern Ig GC, we report a rare example of 'homeologous' recombination insensitive to MMR.


Figures
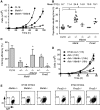
Figure 1.
Figure 1.
Impaired proliferation in MMR-deficient DT40 cells. (A) Growth curves of log-phase cultures of DT40 CL18 cells, its Msh6−/− derivative 1015 and the latter clone expressing human Msh6 (hMsh6). Average cell numbers, corrected by dilution factor, of duplicate cultures ± standard error of the mean are plotted over time. (B) Population doubling times were calculated by exponential curve fit (R2 ≥ 0.95 in every case) of growth curves as in (A). Multiple measurements for both DT40 parental lines used in this work (CL18 and CL18c4) are plotted, as well as one or more measurements of at least two independent cell lines for each of the indicated genotypes. Mean population doubling times (DT) are indicated at the top. (C) Cloning efficiency determined as the proportion of clones arising per 96-well plate after single cell deposition. Mean + standard deviation (SD) of —six to nine plates from two to three experiments are plotted. (D) Growth curves as in (A) with DT indicated in brackets next to each cell line. (E) Flow cytometry profiles of the IgM+ DT40 cell line CL18c4 (Msh6+/+ and Pms2+/+ panels) along with representative Msh6+/ and Msh6−/− or Pms2+/ and Pms2−/− derivatives. In (B) an (C), *P < 0.05 ANOVA with Bonferroni’s post-test.
Figure 2.
Figure 2.
Cell cycle defects in MMR-deficient DT40 cells. (A) Proportion of AnnexinV-positive cells in exponentially growing cultures of the indicated DT40 cell lines. Mean + SD of —five to seven measurements done on CL18 and two independently derived knockout cell lines are plotted. Statistical significance by Student’s unpaired two-tailed t-test. (B) Representative H&E staining images illustrating the presence of large cells with abnormal nuclear morphology in MSH6- and PMS2-deficient DT40. Bar, 20 µm. (C) Cell cycle profile of exponentially growing populations of DT40 cells. DNA was stained with propidium iodide and analysed by flow cytometry. 2n and 4n indicate the G1 and G2/M peaks, respectively (left panels). The population of cells with DNA content >4n was defined as >G2. The bar graphs summarize the mean + SD proportion of cells in each cell cycle stage obtained from seven replicates for CL18 and Msh6−/−, two replicates for Msh6−/− hMsh6 and three replicates for Pms2−/− (right panels). (D) 2D cell cycle analysis of DT40 cells pulsed with BrdU at 0, 5 or 24 h post-cisplatin treatment. BrdU incorporation into DNA was probed with FITC-labelled anti-BrdU antibody and DNA content by propidium iodide staining by flow cytometry. The proportion of cells in each gate is indicated. One representative of two experiments performed is shown.
Figure 3.
Figure 3.
No increase in Ig GC frequency in Msh6−/− or Pms2−/− DT40 cells. (A) Scheme of the frameshift reversion assay used to estimate IgVλ gene conversion frequency by measuring the proportion of DT40 cells gaining surface IgM expression over time. (B) Linear correlation between median proportion of IgM-gain cells and generation number (defined by population doubling time) for multiple DT40 CL18 subpopulations kept in exponential growth. The proportion of IgM+ cells arising from 24 subpopulations of IgM cells was determined by flow cytometry at each indicated number of generations. Median values and data range for two independent experiments (circles and triangles) are plotted with linear fit shown. (C) Multiple IgM subpopulations of DT40 CL18 (n = 24) and its Msh6−/− derivative line 1015 (n = 12) were sorted, independently expanded and analysed for IgM-gain as in (B) after 15, 30, 45 and 60 generations. The IgM+ proportion values are indicated for each subpopulation with medians plotted as horizontal bars. Linear fit of the medians is shown. (D) IgM-gain in multiple subpopulations of CL18 (n = 19), its Msh6−/− derivative lines 102 (n = 12), 1015 (n = 9), 1C1 (n = 19) and 1A5 (n = 9), Msh6−/− Aid−/− A5 (n = 12) and B1 (n = 12), Pms2−/− lines c20 (n = 20), c5 (n = 12) and c11 (n = 12) and the Pms2+/ c21 (n = 12) and c44 (n = 12) (parentals to Pms2−/− c5 and c11) after 70 generations was determined as in (C). The proportion of IgM+ cells in each subpopulation is plotted with medians indicated by horizontal lines and the value above. *P < 0.05 Kruskal–Walis non-parametric test with post-test. (E) Total lysates of DT40 cell lines were separated by sodium dodecyl sulphate–polyacrylamide gel electrophoresis, and AID and actin levels were analysed by western blotting. (F) Populations of 50 IgM CL18 Msh6−/− cells expressing or not Ugi were sorted into 96-well plates and expanded for 45 generations. The proportion of IgM+ cells is plotted for each population (two shades of grey distinguish independent Msh6−/− lines) with median values indicated. (G) Three IgM subpopulations of DT40 CL18, Msh6−/− line 1015 or Aid−/− Msh6−/− lines A5 and B1 were expanded for 45 generations in the presence of 1.25 nM TSA. The proportion of IgM+ cells in each subpopulation is plotted with median values indicated.
Figure 4.
Figure 4.
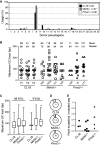
Unaffected Ig gene conversion fidelity in Msh6−/− and Pms2−/−DT40. (A) Donor pseudogene usage. Proportion of IgVλ conversion events templated on each of the 25 IgV pseudogenes plotted for DT40 CL18, Msh6−/− and Pms2−/−. The data compile sequences from subpopulations coming from several fluctuation experiments (CL18 n = 3, Msh6−/− n = 6 and four independent lines, Pms/ n = 3 and three independent lines). The distribution was not significantly different between the different genotypes (two-way ANOVA). (B) Maximum gene conversion tract length was determined for each event obtained from CL18 (three independent experiments, E1–E3) as well as from independent lines of Msh6−/− (two fluctuations compiled for lines 1015 and 1C1) or Pms2−/−. Tract length for each event is plotted with the mean and median (horizontal bars) values above. Differences are not significant by Kruskal–Walies non-parametric test. (C) All data from (B) were aggregated by genotype in box plots with 25–75% percentiles divided by the median and whiskers representing the minimum and maximum values. On the right, a similar plot considered only conversion tracts templated on pseudogene VL8. *P < 0.05 Kruskal–Walis non-parametric test with post-test. In (A–C), only independent events were considered (i.e. identical events found in sequences coming from the same subpopulation were excluded to prevent counting dynastically related events more than once). (D) The number of sequences containing one (white), two (grey) or three (black) conversion events were plotted as proportion of all sequences containing gene conversion events (n, indicated in the central circle). (E) The ratio of point mutations per mutated sequence was calculated for multiple data sets. The highest value in the Pms2−/− data set is biased by the presence of four sequences with multiple clonally related mutations. The empty triangle is the value for the same data set after removing these sequences. Clonally related sequences were not excluded in (D) and (E).
Figure 5.
Figure 5.
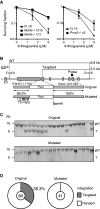
Mismatch sensing and heterology sensitive homologous recombination to in DT40. (A) Two independent Msh6−/− (left panel) and one Pms2−/− (right panel) lines and their respective parental DT40 cells were treated with increasing doses of 6-TG, and surviving fraction was determined 48 h later by MTS viability assays. Mean + SD of three experiments are plotted. (B) Partial scheme of chicken Msh6 and the fully homologous and mutated targeting constructs. The position of the mutations and homology between the constructs are indicated under each relevant segment. The restriction enzymes and probe used for Southern blot, as well as the expected fragment sizes, are shown. (C) Representative Southern blots of DNA from puromycin-resistant clones digested with EcoRI and BamHI. The position of DNA size markers (left), as well as the wild-type (WT) and targeted (T) fragments, are indicated. (D) Proportion of clones having targeted (grey) and random (white) integration of the homologous or mutated Msh6 constructs. The pie charts compile results from two independent experiments with the total number of clones analysed for each construct indicated in the centre.
Figure 6.
Figure 6.
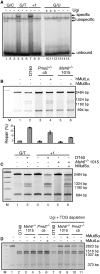
Mismatch binding and repair in DT40 cell extracts. (A) Gel-shift with DT40 WT cell extracts (lanes 1, 4, 7, 10 and 13), cell extracts of the Msh6−/− clones 1015 (lanes 2, 5, 8, 11 and 14) and 1c1 (lanes 3, 6, 9, 12 and 15). The extracts were incubated with the indicated substrates for 20 min at RT, run on a 5% TAE–polyacrylamide gel and exposed to a PhosphorImager screen. (B) MMR assays with extracts of DT40 WT, Pms2−/− and Msh6−/− cell lines. The extracts were incubated with a plasmid containing a G/T mismatch in a SalI restriction site and a nick in the T strand 350 nt 3′ from the mismatch. On repair of the mispaired T, the SalI restriction site is restored, and digestion with this enzyme gives rise to the 1324- and 1160-bp fragments in repair-proficient samples. The mean intensity + standard error proportion of these two product fragments over total signal from two experiments was quantified using ImageQuant and is plotted for each line below the gel. (C) Mismatch repair assay performed as in (B). Extracts of DT40 WT and Msh6−/− cells were incubated with a substrate containing a single-nucleotide insertion (+1). The G/T substrate served as a control of repair efficiency. (D) Mismatch repair assay carried out as described in (B) (lanes 2–6) or after immunodepletion of TDG and inhibition of UNG by the addition of Ugi (lanes 7–11). The substrate used in this assay contained a G/U mismatch in an AclI site and a nick in the U strand 350 nt 3′ from the mismatch. Repair of G/U to G/C restores the AclI site, and digestion with this enzyme gives rise to the 1516- and 1307-bp fragments in repair-proficient samples.

Similar articles

Cited by

References

    1. Di Noia JM, Neuberger MS. Molecular mechanisms of antibody somatic hypermutation. Annu. Rev. Biochem. 2007;76:1–22. - PubMed
    1. Peled JU, Kuang FL, Iglesias-Ussel MD, Roa S, Kalis SL, Goodman MF, Scharff MD. The biochemistry of somatic hypermutation. Annu. Rev. Immunol. 2008;26:481–511. - PubMed
    1. Reynaud CA, Anquez V, Grimal H, Weill JC. A hyperconversion mechanism generates the chicken light chain preimmune repertoire. Cell. 1987;48:379–388. - PubMed
    1. Reynaud CA, Dahan A, Anquez V, Weill JC. Somatic hyperconversion diversifies the single Vh gene of the chicken with a high incidence in the D region. Cell. 1989;59:171–183. - PubMed
    1. Chaudhuri J, Alt FW. Class-switch recombination: interplay of transcription, DNA deamination and DNA repair. Nat. Rev. Immunol. 2004;4:541–552. - PubMed

Publication types