. 2013;8(1):e53138.
doi: 10.1371/journal.pone.0053138. Epub 2013 Jan 7.

Cell-to-cell transmission can overcome multiple donor and target cell barriers imposed on cell-free HIV

Affiliations

Cell-to-cell transmission can overcome multiple donor and target cell barriers imposed on cell-free HIV

Peng Zhong et al. PLoS One. 2013.

Abstract

Virus transmission can occur either by a cell-free mode through the extracellular space or by cell-to-cell transmission involving direct cell-to-cell contact. The factors that determine whether a virus spreads by either pathway are poorly understood. Here, we assessed the relative contribution of cell-free and cell-to-cell transmission to the spreading of the human immunodeficiency virus (HIV). We demonstrate that HIV can spread by a cell-free pathway if all the steps of the viral replication cycle are efficiently supported in highly permissive cells. However, when the cell-free path was systematically hindered at various steps, HIV transmission became contact-dependent. Cell-to-cell transmission overcame barriers introduced in the donor cell at the level of gene expression and surface retention by the restriction factor tetherin. Moreover, neutralizing antibodies that efficiently inhibit cell-free HIV were less effective against cell-to-cell transmitted virus. HIV cell-to-cell transmission also efficiently infected target T cells that were relatively poorly susceptible to cell-free HIV. Importantly, we demonstrate that the donor and target cell types influence critically the extent by which cell-to-cell transmission can overcome each barrier. Mechanistically, cell-to-cell transmission promoted HIV spread to more cells and infected target cells with a higher proviral content than observed for cell-free virus. Our data demonstrate that the frequently observed contact-dependent spread of HIV is the result of specific features in donor and target cell types, thus offering an explanation for conflicting reports on the extent of cell-to-cell transmission of HIV.


Conflict of interest statement

Competing Interests: The authors have declared that no competing interests exist.

Figures

Figure 1
Figure 1. Experimental approach for comparing HIV transmission by cell-free virus or by transmission in co-cultures.
(A) Left panel: Schematic illustration of cell-free and cell-to-cell transmission. Viruses should be able to spread by cell-free transmission if individual steps of the viral life cycle are efficient (1 = viral gene expression, 2 = virus release, 3 = stability of extracellular virus, 4 = virus entry into target cell). Right panel: Schematic illustration for the experimental comparison of HIV transmission by cell-free virus or by transmission in co-cultures using the same pool of transfected virus-producer cells. See text for details. (B) Transmission of HIVNL4-3-GLuc by cell-free or in co-cultures were compared between highly permissive donor HEK293 and target cells (HEK293 and HeLa cells expressing CD4 and CXCR4 receptors, MT4 T cells). Infectivity was measured as relative light units of luciferase (RLU). Error bars represent the standard error of the mean from 2–8 experiments.
Figure 2
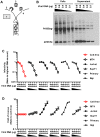
Figure 2. Co-culture can overcome low viral gene expression.
(A) A barrier was placed into the cell-free path of HIV by lowering viral gene expression. (B) HEK293 producer cells transfected in 12-well plates with decreasing amounts of viral plasmid DNA (µg) were incubated for 30 h and cell lysates and viral supernatant were analyzed by Western blot using α-p24 antibodies. (C) Relative HIVNL4-3-GLuc infectivity released by HEK293 producer cells (red) or transmitted from producer cells to indicated target cell types in co-cultures. Infectivity measured for the highest amount of transfected DNA was set to 1. (D) Fold of rescue of co-culture over cell-free from (C). Fold-rescue was determined by calculating the ratio of the infectivity in co-cultures over the infectivity of cell-free virus at the corresponding plasmid dose. Error bars represent the standard error of the mean from 3 experiments.
Figure 3
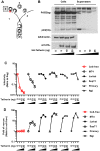
Figure 3. The reduction in release of cell-free HIVΔvpu by tetherin is overcome in co-cultures.
(A) A barrier was placed into the cell-free path of HIV at the step of virus release by expressing tetherin. (B) HEK293 cells producing HIVLAI-Δvpu and increasing amounts of tetherin (ng) were analyzed for viral gene expression in cells and virus release into the culture supernatant by Western blotting using the α-p24 antibody. The expression of HA-tagged tetherin was confirmed using α-HA antibodies. (C) Relative HIVLAI-Δvpu-GLuc infectivity released by HEK293 producer cells expressing increasing amounts of tetherin (red) or transmitted from producer cells to indicated target cell types in co-cultures. The ratio of infectivity to non-tetherin expressing cells was calculated. (D) Fold of rescue of co-culture over cell-free for the data shown in (C). Fold-rescue was determined by calculating the ratio of the infectivity in co-cultures over the infectivity of cell-free virus at the corresponding tetherin plasmid dose. Error bars represent the standard error of the mean from 3 experiments. The effects of tetherin expression on wild-type HIVLAI are presented in Figure S2.
Figure 4
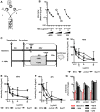
Figure 4. Sensitivity of HIV transmission by cell-free virus or by transmission in co-cultures to neutralizing antibodies.
(A) A barrier was placed into the cell-free path of HIV at the extracellular step using neutralizing antibodies. (B) The infectivity of cell-free HIVNL4-3-GLuc on MT4 cells was measured in the absence and presence of increasing amounts of neutralizing antibodies (NAb) 4E10, 2G12, and 2F5 (µg/ml). Infectivity was normalized to 1 using mock-treated control. (C) Scheme depicts the experimental approach to test the sensitivity of HIV spreading in co-cultures to neutralizing antibodies. At 6 h post-transfection, donor and target cells were co-cultured and cell-cell contacts were allowed to form for 2 h. Transmission events occurring during these 2 h were measured by terminating transmission with saquinavir (SQV) and allowing all previous infection events to proceed for 36 h and result in luciferase expression. These base level infections were set to 1. In parallel, the ability of neutralizing antibodies (NAb) to interfere with the spreading of infection to indicated cell types during a window of 4 h was determined. At the end of the 4 h incubation transmissions were terminated using SQV and the produced luciferase was determined 32 h later. (D–F) Dose response for indicated neutralizing antibodies 4E10, 2G12, 2F5 in co-cultures of HEK293 HIV-producer cells with the indicated target cell lines as described in (C). (G) The data point at 2.5 µg/ml from figures D–F. Infectivity is normalized to the baseline infection levels measured during the first 2 h of co-culture. Error bars represent the standard error of the mean from 3 experiments.
Figure 5
Figure 5. Co-culture can overcome an entry barrier into poorly susceptible T cells.
(A) The existence of potential entry barriers in the cell-free path of HIV transmission was explored by varying target cells. (B) An experiment as in (Figure 1B) was performed to compare cell-free HIVNL4-3-GLuc infection and spreading infections in co-cultures of HEK293 donor cells with indicated target cells. For comparison, the data for permissive HeLa and MT4 from Figure 1B are shown to the left. Error bars represent the standard error of the mean from 7–8 experiments. (C) The binding capability of cell-free HIVNL4-3-GLuc on indicated cell types was tested at 37°C for 2 h (∼9 ng/ml of p24). The cells were then washed to remove unbound particles. Cells were then lysed and analyzed by α-p24-ELISA. “ND” for “non-detectable” by ELISA in >600,000 infected cells. Error bars represent the standard error of the mean from 2 experiments. (D) Relative virus binding was measured as in (C) for indicated cell types following spinoculation with concentrated HIVNL4-3-GLuc virus (∼600 ng/ml). (E) Late reverse transcription was measured following incubation at 37°C for 36 h. Data shown in D–E were determined in parallel within one experiment and 3 experiments were combined. Error bars represent the standard error of the mean.
Figure 6
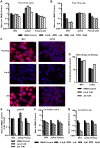
Figure 6. The actin cytoskeleton of Jurkat cells presents a barrier to cell-free HIV infection.
(A, B) MT4, Jurkat and primary CD4 T cells were inoculated with concentrated cell-free HIVNL4-3-GLuc by spinoculation and incubated at 37°C in the presence or absence of increasing concentrations of latrunculin-A (Lat-A) or japlakinolide (Jas)(µM). Luciferase activity was measured 36 h post-inoculation. Data were normalized to DMSO control. Error bars represent the standard error of the mean from 2 experiments. (C) Phalloidin staining of untreated, Lat-A-, and Jas-treated cells. Cells were exposed to Lat-A (1 µM for MT4 and 0.5 µM for Jurkat) or Jas (0.5 µM for MT-4 and 0.0625 µM for Jurkat) for 1 h at 37°C. Note that phalloidin competes with Jas for binding to polymerized actin and further dilution of drug was required to observe actin staining in Jurkat cells . Size bars correspond to 10µm. (D) Viral binding was measured by α-p24-ELISA after spinoculating cells in the presence or absence of 1 µM Lat-A or Jas. Error bars represent the standard deviation from 3 measurements. (E) Late reverse transcription (RT) was measured by Q-PCR from cells treated with 1 µM of Lat-A or Jas. Error bars represent the standard deviation of 3 late RT measurements. (F, G) A co-culture experiment as in Figure 5B was performed in the presence of increasing concentrations of Lat-A or Jas (µM). Error bars represent the standard error of the mean from 2 experiments.
Figure 7
Figure 7. The relative contribution of cell-free to co-culture mediated transmission is affected by the donor cell type.
Different donor cells (HEK293, HeLa, Jurkat) were co-cultured with HeLa cells expressing CD4/CXCR4, MT4 cells and Jurkat cells. The efficiency of virus transmission in the cell-free mode and in the co-culture-dependent mode was compared as described in Figure 1A. Data for HEK293 donor cells are as Figure 5B. Error bars represent the standard error of the mean from 2 experiments.
Figure 8
Figure 8. Concentration of HIV-Gag to sites of cell-cell contacts.
(A–C) HEK293 cells were co-transfected with HIVNL4-3 and fluorescently tagged HIVNL4-3-GFP (green) or HIVNL4-3-RFP (red) and co-cultured with the dye-labeled target T cells MT4 cells (CFSE, green)(A), Jurkat cells (CMTPX, red))(B), and SupT1 cells (CFSE, green)(C) and imaged by confocal fluorescence microscopy. Size bars represent 10 µm.
Figure 9
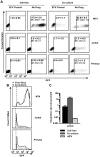
Figure 9. Co-culturing cells leads to a larger proportion of infected target cells and a higher proviral content.
(A) Infection by cell-free or by co-cultures with MT4, Jurkat or primary CD4+ T cells were repeated as in Figure 5B using HEK293 donor cells producing HIVIRES-GFP. Target cells were identified based on their expression of CD2 (MT4 cells) or CD3 (Jurkat and primary CD4 T cells). GFP fluorescence was gated based on the background fluorescence from a corresponding sample treated with 1 µM of efavirenz (EFV). Numbers represent the average percent of GFP-positive cells +/− the standard deviation of 2 (efavirenz control) or 6 (no drug) inoculations. MFI values correspond to the average mean fluorescence +/− the standard deviation of 2 (efavirenz control) or 6 (no drug) inoculations. (B) Comparison of the GFP fluorescence intensity of cells infected by cell-free virus or by co-culture from the gated population in panel (A). Histograms represent the combination of 3 measurements. Fluorescence was normalized to the fluorescence from the corresponding efavirenz-controls to account for fluorescence shifts due to sample variability. The grey dashed line represents cell-free infection and solid black line represent co-culture infection. The black vertical dashed line represents the limit of the gates shown in (A). (C) An experiment as in (A) was repeated with wild-type HIVNL4-3 and target cells were stained with CFSE. CFSE-positive cells expressing HIV Gag above the efavirenz-treated control (see Figure S5) were sorted and the number of HIV integration events was analyzed by Alu-PCR. Control samples were treated with 1 µM efavirenz (+EFV). Error bars represent the standard deviation of 3 measurements of integration.
Figure 10
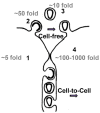
Figure 10. Size of barriers experimentally introduced into the cell-free path of HIV.
By interfering with the cell-free path of HIV, these barriers tilt virus transmission towards contact-dependent modes. See text for details.

Similar articles

Cited by

References

    1. Phillips DM (1994) The role of cell-to-cell transmission in HIV infection. Aids 8: 719–731. - PubMed
    1. Mothes W, Sherer NM, Jin J, Zhong P (2010) Virus cell-to-cell transmission. J Virol 84: 8360–8368. - PMC - PubMed
    1. Johnson DC, Huber MT (2002) Directed egress of animal viruses promotes cell-to-cell spread. J Virol 76: 1–8. - PMC - PubMed
    1. Sattentau Q (2008) Avoiding the void: cell-to-cell spread of human viruses. Nat Rev Microbiol 6: 815–826. - PubMed
    1. Helenius A, Kartenbeck J, Simons K, Fries E (1980) On the entry of Semliki forest virus into BHK-21 cells. J Cell Biol 84: 404–420. - PMC - PubMed

Publication types

Substances