

Genetic origins of social networks in rhesus macaques
- PMID: 23304433
- PMCID: PMC3540398
- DOI: 10.1038/srep01042
Genetic origins of social networks in rhesus macaques
Abstract
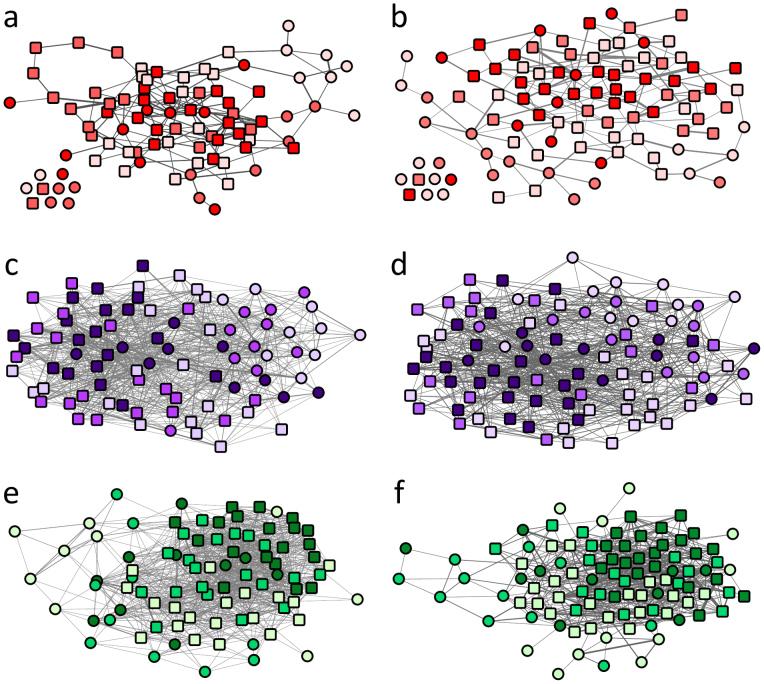
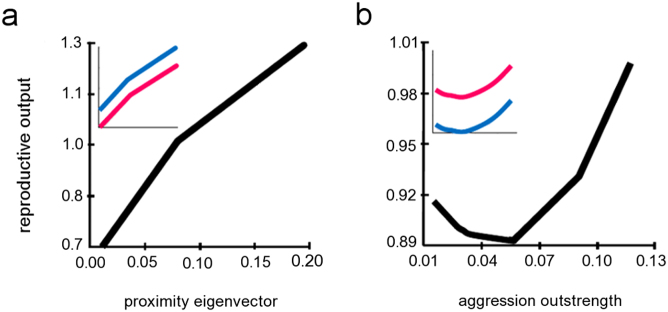
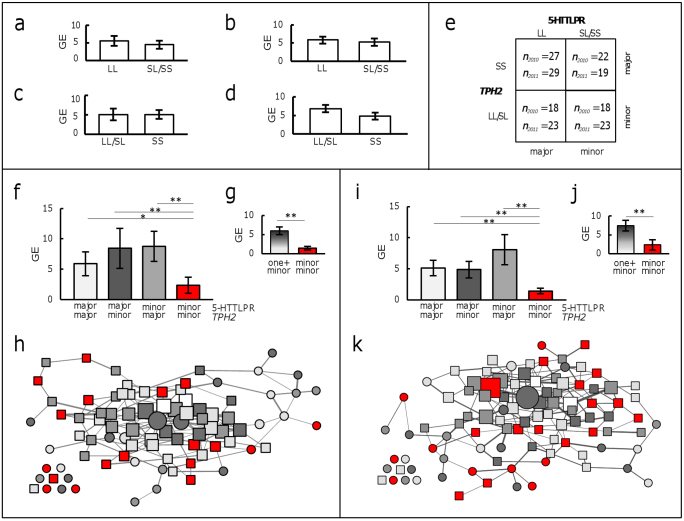
Sociality is believed to have evolved as a strategy for animals to cope with their environments. Yet the genetic basis of sociality remains unclear. Here we provide evidence that social network tendencies are heritable in a gregarious primate. The tendency for rhesus macaques, Macaca mulatta, to be tied affiliatively to others via connections mediated by their social partners - analogous to friends of friends in people - demonstrated additive genetic variance. Affiliative tendencies were predicted by genetic variation at two loci involved in serotonergic signalling, although this result did not withstand correction for multiple tests. Aggressive tendencies were also heritable and were related to reproductive output, a fitness proxy. Our findings suggest that, like humans, the skills and temperaments that shape the formation of multi-agent relationships have a genetic basis in nonhuman primates, and, as such, begin to fill the gaps in our understanding of the genetic basis of sociality.
Figures
Similar articles
-
Differential functional variability of serotonin transporter and monoamine oxidase a genes in macaque species displaying contrasting levels of aggression-related behavior.Behav Genet. 2006 Mar;36(2):163-72. doi: 10.1007/s10519-005-9017-8. Epub 2005 Dec 30. Behav Genet. 2006. PMID: 16402281
-
Weak effects of common genetic variation in oxytocin and vasopressin receptor genes on rhesus macaque social behavior.Am J Primatol. 2018 Oct;80(10):e22873. doi: 10.1002/ajp.22873. Epub 2018 Jun 21. Am J Primatol. 2018. PMID: 29931777 Free PMC article.
-
Genetic heterozygosity and sociality in a primate species.Behav Genet. 2008 Mar;38(2):151-8. doi: 10.1007/s10519-008-9191-6. Epub 2008 Feb 22. Behav Genet. 2008. PMID: 18293079
-
The utility of the non-human primate; model for studying gene by environment interactions in behavioral research.Genes Brain Behav. 2003 Dec;2(6):336-40. doi: 10.1046/j.1601-1848.2003.00051.x. Genes Brain Behav. 2003. PMID: 14653305 Review.
-
Single nucleotide polymorphisms, variable number tandem repeats and allele influence on serotonergic enzyme modulators for aggressive and suicidal behaviors: A review.Pharmacol Biochem Behav. 2019 May;180:74-82. doi: 10.1016/j.pbb.2019.03.008. Epub 2019 Mar 27. Pharmacol Biochem Behav. 2019. PMID: 30928299 Review.
Cited by
-
Social ageing can protect against infectious disease in a group-living primate.Philos Trans R Soc Lond B Biol Sci. 2024 Dec 16;379(1916):20220462. doi: 10.1098/rstb.2022.0462. Epub 2024 Oct 28. Philos Trans R Soc Lond B Biol Sci. 2024. PMID: 39463240 Free PMC article.
-
Generation-based life table analysis reveals manifold effects of inbreeding on the population fitness in Plutella xylostella.Sci Rep. 2015 Jul 31;5:12749. doi: 10.1038/srep12749. Sci Rep. 2015. PMID: 26227337 Free PMC article.
-
Genetic Analysis of Novel Behaviour Traits in Pigs Derived from Social Network Analysis.Genes (Basel). 2022 Mar 23;13(4):561. doi: 10.3390/genes13040561. Genes (Basel). 2022. PMID: 35456367 Free PMC article.
-
Quantitative Genetics of Response to Novelty and Other Stimuli by Infant Rhesus Macaques (Macaca mulatta) Across Three Behavioral Assessments.Int J Primatol. 2014 Feb 1;35(1):325-339. doi: 10.1007/s10764-014-9750-z. Int J Primatol. 2014. PMID: 24701001 Free PMC article.
-
Impact of internal and external factors on prosocial choices in rhesus macaques.Philos Trans R Soc Lond B Biol Sci. 2021 Mar;376(1819):20190678. doi: 10.1098/rstb.2019.0678. Epub 2021 Jan 11. Philos Trans R Soc Lond B Biol Sci. 2021. PMID: 33423628 Free PMC article.
References
-
- Wilson E. O. Sociobiology: The New Synthesis (The Belknap Press of Harvard University Press, 1975).
-
- Cheney D., Seyfarth R. & Smuts B. Social relationships and social cognition in nonhuman primates. Science 234, 1361–1366 (1986). - PubMed
-
- Silk J. B., Alberts S. C. & Altmann J. Social bonds of female baboons enhance infant survival. Science 302, 1231–1234 (2003). - PubMed
Publication types
MeSH terms
Substances
Grants and funding
LinkOut - more resources
Full Text Sources
Other Literature Sources
