. 2013;11(1):e1001455.
doi: 10.1371/journal.pbio.1001455. Epub 2013 Jan 3.

The circadian clock coordinates ribosome biogenesis

Affiliations

The circadian clock coordinates ribosome biogenesis

Céline Jouffe et al. PLoS Biol. 2013.

Abstract

Biological rhythms play a fundamental role in the physiology and behavior of most living organisms. Rhythmic circadian expression of clock-controlled genes is orchestrated by a molecular clock that relies on interconnected negative feedback loops of transcription regulators. Here we show that the circadian clock exerts its function also through the regulation of mRNA translation. Namely, the circadian clock influences the temporal translation of a subset of mRNAs involved in ribosome biogenesis by controlling the transcription of translation initiation factors as well as the clock-dependent rhythmic activation of signaling pathways involved in their regulation. Moreover, the circadian oscillator directly regulates the transcription of ribosomal protein mRNAs and ribosomal RNAs. Thus the circadian clock exerts a major role in coordinating transcription and translation steps underlying ribosome biogenesis.


Conflict of interest statement

The authors have declared that no competing interests exist.

Figures
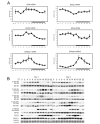
Figure 1
Figure 1. Temporal expression and phosphorylation of translation initiation factors.
(A) Temporal mRNA expression profile of translation initiation factors in mouse liver. For each time point, data are mean ± standard error of the mean (SEM) obtained from four independent animals. (B) Temporal protein expression and phosphorylation of translation initiation factors in mouse liver during two consecutive days. Western blots were realized on total or nuclear (PER2 and BMAL1) liver extracts. PER2 and BMAL1 accumulations are shown as controls for diurnal synchronization of the animals. Naphtol blue black staining of the membranes was used as a loading control. The lines through gels indicate where the images have been cropped. The zeitgeber times (ZT), with ZT0, lights on; ZT12, lights off, at which the animals were sacrificed, are indicated on each panel.
Figure 2
Figure 2. Temporal activation of signaling pathways controlling translation initiation.
(A) Temporal expression and phosphorylation of representative proteins of key signaling pathways regulating translation initiation in mouse liver during two consecutive days. Western blots were performed on total liver extracts. Naphtol blue black staining of the membranes was used as a loading control. (B) Temporal binding of EIF4E and 4E-BP1 to 7-methyl-GTP-sepharose during two consecutive days. Total liver extracts were incubated with 7-methyl-GTP beads mimicking the mRNA cap structure. After washing of the beads, bound proteins were analyzed by Western blotting. The zeitgeber times (ZT), with ZT0, lights on; ZT12, lights off, at which the animals were sacrificed, are indicated on each panel. The lines through gels indicate where the images have been cropped.
Figure 3
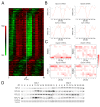
Figure 3. Rhythmic translation of ribosomal proteins in mouse liver.
(A) Temporal expression profiles of microarray probes showing a rhythmic ratio of polysomal to total RNAs, ordered by phase. For visualization, data were mean centered and standardized. Log-ratios are color-coded so that red indicates high and green low relative levels of polysomal mRNAs compared to the total fraction. (B) Examples of temporal expression profiles of a subset of rhythmically translated 5′-TOP genes identified in our microarray experiment. Traces represent the levels of mRNA expression measured by microarray in the total RNA (blue line) and polysomal fraction (red line). Data are represented in log scale following standard normalization. (C) Temporal location of Gapdh and selected genes showing translational regulation mRNA on the different gradients obtained after polysomes purification. Pools of RNA obtained from four animals were used for each fraction at each time point. The color intensity represents for each time point the relative abundance of the mRNA in each fraction. Fractions 1–2 represent heavy polysomes, 2–3, light polysomes, and 9–10, free mRNAs. Note that even for Gapdh mRNA, translation slightly decreases at the end of the light period. (D) Temporal expression of selected rhythmically translated ribosomal proteins in liver cytoplasmic extracts during two consecutive days. Naphtol blue black staining of the membranes was used as a loading control. The lines through gels indicate where the images have been cropped. The zeitgeber times (ZT) at which the animals were sacrificed are indicated on each panel.
Figure 4
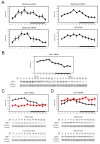
Figure 4. Rhythmic transcription of RP mRNA and rRNA through circadian clock regulated expression of UBF1.
(A) Temporal real-time RT-PCR profile of RP pre-mRNA and 45S rRNA precursor expression in mouse liver. For each time point, data are mean ± standard error of the mean (SEM) obtained from four independent animals. (B) Temporal Ubf1 mRNA (upper panel) and protein (lower panel) expression in mouse liver. mRNA were measured by real-time RT-PCR and, for each time point, data are mean ± SEM obtained from four independent animals. UBF1 protein expression was measured by Western blot on nuclear extracts during two consecutive days. The lines through gels indicate where the images have been cropped. (C–D) Temporal Ubf1 expression in mice devoid of a functional circadian clock. Ubf1 expression was measured by real-time RT-PCR with liver RNAs obtained from arrhythmic Cry1/Cry2 (C) and Bmal1 (D) KO mice and their control littermates (upper panel). Data are mean ± SEM obtained from three and two animals, respectively. Black line corresponds to the WT animals and red line to the KO. Protein levels (lower panel) were measured by Western blot on nuclear extracts. The zeitgeber times (ZT) at which the animals were sacrificed are indicated on each panel. Naphtol blue black staining of the membranes was used as a loading control.
Figure 5
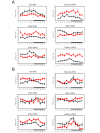
Figure 5. Rhythmic RNA expression of factors involved in ribosomes biogenesis is disrupted in arrhythmic Cry1/Cry2 and Bmal1 KO mice.
Temporal expression of factors involved in ribosomes biogenesis in Cry1/Cry2 (A) and Bmal1 (B) KO mice and their control littermates. Temporal real-time RT-PCR expression profile of 45S rRNA precursor, Rpl23 pre-mRNA, and translation initiation factors expression in mouse liver. Black line corresponds to the WT animals and red line to the KO. For each time point, data are mean ± SEM obtained from three (A) and two (B) independent animals. The zeitgeber times (ZT) at which the animals were sacrificed are indicated on each panel.
Figure 6
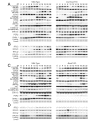
Figure 6. Rhythmic expression and phosphorylation of actors of ribosomes biogenesis is disrupted in arrhythmic Cry1/Cry2 and Bmal1 KO mice.
(A–C) Temporal expression and phosphorylation of translation initiation factors and representative indicators of signaling pathways controlling their activation in Cry1/Cry2 (A) and Bmal1 (C) KO mice and their control littermates. Western blots were realized on total or nuclear (PER2 and BMAL1) liver extracts from WT (left panel) and KO (right panel) animals. (B–D) Temporal expression of selected rhythmically translated ribosomal proteins in liver from Cry1/Cry2 (B) and Bmal1 (D) KO mice and their control littermates. Western blots were realized on cytoplasmic extracts from WT (left panel) and KO (right panel) animals. The zeitgeber times (ZT) at which the animals were sacrificed are indicated on each panel. PER2 and BMAL1 accumulations are shown as controls for diurnal synchronization of the animals. Naphtol blue black staining of the membranes was used as a loading control.
Figure 7
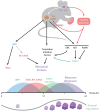
Figure 7. Model describing the coordination of ribosome biogenesis by the circadian clock.
The molecular oscillator in the master circadian pacemaker localized in the SCN of the hypothalamus synchronizes peripheral clocks, including liver clock, and, in parallel, regulates feeding behavior, which itself influences peripheral oscillator. The liver circadian clock controls expression of translation initiation factors, and rRNA, and conceivably RP mRNA, through regulation of UBF1. In addition, in association with signals from nutrients, the molecular clock, via the TORC1 pathway, coordinates the rhythmic activation of signaling pathways controlling translation of RP and, in turn, ribosome biogenesis. This succession of events coordinated by the circadian clock finally leads to a subtle rhythmic change of general translation in mouse liver.

Comment in

Similar articles

Cited by

References

    1. Bass J, Takahashi JS (2010) Circadian integration of metabolism and energetics. Science 330: 1349–1354. - PMC - PubMed
    1. Zhang EE, Kay SA (2010) Clocks not winding down: unravelling circadian networks. Nat Rev Mol Cell Biol 11: 764–776. - PubMed
    1. Doherty CJ, Kay SA (2010) Circadian control of global gene expression patterns. Annu Rev Genet 44: 419–444. - PMC - PubMed
    1. Reddy AB, Karp NA, Maywood ES, Sage EA, Deery M, et al. (2006) Circadian orchestration of the hepatic proteome. Curr Biol 16: 1107–1115. - PubMed
    1. Panda S, Antoch MP, Miller BH, Su AI, Schook AB, et al. (2002) coordinated transcription of key pathways in the mouse by the circadian clock. Cell 109: 307–320. - PubMed

Publication types

MeSH terms

Associated data