Review
. 2013 Mar;59(3):301-15.
doi: 10.1016/j.ymeth.2012.12.005. Epub 2012 Dec 24.

Microscale thermophoresis quantifies biomolecular interactions under previously challenging conditions

Affiliations
Review

Microscale thermophoresis quantifies biomolecular interactions under previously challenging conditions

Susanne A I Seidel et al. Methods. 2013 Mar.

Abstract

Microscale thermophoresis (MST) allows for quantitative analysis of protein interactions in free solution and with low sample consumption. The technique is based on thermophoresis, the directed motion of molecules in temperature gradients. Thermophoresis is highly sensitive to all types of binding-induced changes of molecular properties, be it in size, charge, hydration shell or conformation. In an all-optical approach, an infrared laser is used for local heating, and molecule mobility in the temperature gradient is analyzed via fluorescence. In standard MST one binding partner is fluorescently labeled. However, MST can also be performed label-free by exploiting intrinsic protein UV-fluorescence. Despite the high molecular weight ratio, the interaction of small molecules and peptides with proteins is readily accessible by MST. Furthermore, MST assays are highly adaptable to fit to the diverse requirements of different biomolecules, such as membrane proteins to be stabilized in solution. The type of buffer and additives can be chosen freely. Measuring is even possible in complex bioliquids like cell lysate allowing close to in vivo conditions without sample purification. Binding modes that are quantifiable via MST include dimerization, cooperativity and competition. Thus, its flexibility in assay design qualifies MST for analysis of biomolecular interactions in complex experimental settings, which we herein demonstrate by addressing typically challenging types of binding events from various fields of life science.


Conflict of interest statement

Conflict of interest statement: Stefan Duhr and Philipp Baaske are founders, Moran Jerabek-Willemsen is an employee of the LMU spin-off company NanoTemper Technologies GmbH, which provides services and devices based on MST.

Figures

Fig. 1
Fig. 1. Microscale thermophoresis
A) MST setup. The sample solution inside a capillary placed on a temperature-controlled sample tray (TC) is locally heated with an IR-laser (IR), which is coupled into the path of fluorescence excitation and emission with an IR reflecting “hot”-mirror (HM). FO: Fluorescence observation; OBJ: objective. B) Schematic representation of the fluorescence time trace recorded by the MST instrument. A series of processes can be separated from each other: The initial fluorescence (I) drops fast as soon as the heating IR-laser is turned on (t=5 s). This T-jump (II) on a 100 ms timescale depicts the fluorophore's temperature sensitivity. It can easily be separated from the following diffusion-limited thermophoresis (III) lasting several seconds. Both T-jump and thermophoresis can be influenced by a binding event. Turning off the IR laser (t=35 s) leads to the inverse T-jump (IV) and the backdiffusion (V). The fluorescence after thermodiffusion (F1) is normalized to the fluorescence F0 which is either the initial fluorescence (depicted here) or the fluorescence after the T-jump. In the former case shown here, thermophoresis and T-jump are both included in the signal analysis whereas in the latter, only thermophoresis is captured.
Fig. 2
Fig. 2. MST quantifies the TEM1-BLIP interaction in agreement with SPR literature values
A) By fitting the change in thermophoretic depletion upon titration of wt-BLIP to a constant amount of wt-TEM1 labeled with the fluorescent dye NT647 to the quadratic solution of the mass action law, a binding constant of KD=3.8±0.8 nM was determined. B) The W112A-mutation in BLIP reduces the affinity to TEM1 to 0.5±0.1 μM. C) W150A-BLIP binds TEM1 with an even lower affinity of KD=1.7±0.4 μM. D) In a reversed assay design, the concentration of the fusion protein Ypet-wt-BLIP was kept constant while titrating in wt-TEM1. In concordance with the binding curve shown in A, a KD of 4.8±1.7 nM was determined (black circles). Mutated R243A-TEM1 showed a lower affinity of KD=0.19±0.05 μM (red triangles). In cell lysate, the KD between Ypet-wt-BLIP and wt-TEM1 was quantified as 10±4 nM, thus demonstrating the applicability of MST for measurements in complex bioliquids. Notably, the sign of the MST signal amplitude is changed in lysate compared to buffer due to differences in pH, ionic strength etc.
Fig. 3
Fig. 3. Grb2 dimerization quantified thermophoretically
Unlabeled Grb2 is titrated to a constant amount of fluorescently labeled Grb2-NT647. Dimerization causes a change in thermophoresis from which a KD of 0.65±0.08 μM was derived. MST allows the usage of protein concentrations far below this KD—an obligatory prerequisite for dimerization quantification. Figure adapted with permission from Lin et al. [1]
Fig. 4
Fig. 4. The AMA1-RON2 binding analyzed via MST, SPR and FP
A) Titration of the AMA1 protein to a constant amount of RON2-FITC peptide induces a pronounced MST signal change (KD=28±3 nM). B) Titrating the peptide (4.3 kDa) to a constant AMA1-NT647 (66 kDa) concentration yielded an MST signal despite the unfavorable size ratio. The signal indicated a biphasic event. Fitting the high affinity phase (blue) reveals a KD of 62±16 μM, which is similar to the reverse titration (Fig.4 A). Fitting the low affinity phase (red) yields a KD of 1.4±0.2 μM, which putatively results from the binding of a non-cyclized RON2 population. Inset: Instead of two independent fits for the two phases, one fit function assuming two binding events is used. This yields similar KDs of 81±21 μM and 1.2±0.1 μM. C) SPR with immobilized RON2 and five different concentrations of AMA1 yields KD=13±1 nM confirming MST. D) Via the reversed SPR assay design, a similar KD of 38.3±0.4 nM is determined. A heterogeneous ligand model fits the dissociation phase best, thus also indicating a biphasic event as observed in MST. E) FP yields a reliable result when titrating the larger binding partner, AMA1 (EC50 48±11 nM). F) Titrating the small peptide instead reduces the FP signal amplitude significantly. An EC50 of 77.1±0.2 nM is estimated from the initial phase (the last three points were omitted because they appeared to represent the onset of a second phase in that range).
Fig. 5
Fig. 5. Label-free MST for quantification of GPCR NTS1B ligand binding
A) Homology model of neurotensin receptor 1 (NTS1; Satita Tapaneeyakorn, Biomembrane structure unit, University of Oxford) based on rhodopsin for the transmembrane regions and the β-adrenergic receptors for the loop regions viewed from the side (left) and top (right). Residues involved in binding of neurotensin (W339, F344 and Y347, cyan), inverse agonist SR48692 (Y324, Y351, T354, F358 and Y359, green) or both (M208, F331 and R327, magenta), as determined from mutagenesis studies [71], are highlighted. B) Label-free MST utilizes NTS1B's intrinsic Trp fluorescence to quantify the binding to neurotensin (KD≤20 nM). C) In agreement with other biophysical techniques, MST using fluorescently labeled neurotensin yields a lower affinity (KD=21±20 nM). D) Using label-free MST, a KD of 15±11 nM for the inverse agonist SR48692 was determined (black circles). Pre-saturating NTS1 with neurotensin right-shifts the KD for SR48692 to 640±50 nM (red squares). Denatured NTS1B did not show binding to SR48692 thus proving specificity (blue triangles).
Fig. 6
Fig. 6. Label-free MST for quantification of GPCR A2AR ligand binding
A) Binding of the orthosteric anatagonists caffeine (KD=40±17 μM; black circles), theophylline (KD=5±2 μM; red squares) and ZM241385 (KD≤43 nM; blue triangles) to A2aR induces a comparably small change in thermophoretic mobility. B) In contrast, amiloride-binding (KD=52±7 μM; green inverted triangles) leads to a much larger MST signal amplitude, thus indicating conformational changes upon binding. Comparable signal amplitudes were obtained for the binding of caffeine and theophylline in presence of saturating amiloride concentrations, where the apparent affinities were decreased to 84±10 μM for caffeine and 27±6 μM for theophylline.
Fig. 7
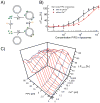
Fig. 7. Lipid and Ca2+-binding to synaptotagmin-1 by MST
A). Scheme of the binding interactions of synaptotagmin-1 (green) to Ca2+ (orange) and liposomes containing PIP2 (grey). Note the two possible binding pathways A1–A2 and B1–B2. B) Membrane binding as a function of PIP2 incorporated into 100 nm-sized liposomes (5% PIP2 total lipid concentration). The apparent binding coefficients were 50±10 and 13±3 μM PIP2 in the absence (red squares) and presence (black circles) of 50 μM Ca2+, respectively (see [56] for details). C) Cooperative Ca2+ and PIP2 binding to synaptotagmin-1. Ca2+ and PIP2 binding affinities could be determined by fitting the blue and red axis of the three dimensional MST curve, respectively. In the presence of saturating concentrations of PIP2, the apparent Ca2+-binding constant decreased from ~220 to 3.3 μM Ca2+. Accordingly, in the presence of saturating Ca2+ concentrations, the apparent PIP2-binding constant decreased from ~20 to <2 μM PIP2. Figure adapted with permission from [56]
Fig. 8
Fig. 8. MST analysis of small molecule binding to G9a
A) The specific interaction of the small molecule BIX-01294 to G9a was quantified via label-free MST (red squares) as well as standard MST with a NT495-label (black circles), where the results were in excellent agreement with each other (KD=0.7±0.2 μM for both) and confirmed previously reported ITC measurements. B) The affinity of the peptide b-H3(1–21) to both G9a-NT495 (black circles) and G9a-NT647 (red squares) was quantified via MST yielding identical KDs (1.5±0.4 μM for G9a-NT495 and 1.5±0.2 μM for G9a-NT647). C) Pre-incubating G9a with b-H3(1–21) right-shifted the KD for BIX-01294 from 0.7 μM (black circles) to 4±1 μM in presence of 2 μM (red squares) and to 37±7 μM (blue triangles) in presence of 100 μM of the peptide suggesting competition at the histone binding site. D) In contrast, addition of SAM in concentrations of 20 μM (KD=1.4±0.3 μM, red squares) and 300 μM (KD=1.2±0.4 μM, blue triangles) only had a minor effect on the apparent KD of BIX-01294 to G9a.

Similar articles

Cited by

References

    1. Lin CC, Melo FA, Ghosh R, Suen KM, Stagg LJ, Kirkpatrick J, Arold ST, Ahmed Z, Ladbury JE. Inhibition of Basal FGF Receptor Signaling by Dimeric Grb2. Cell. 2012;149:1514–1524. - PubMed
    1. Besteiro S, Michelin A, Poncet J, Dubremetz JF, Lebrun M. Export of a Toxoplasma gondii rhoptry neck protein complex at the host cell membrane to form the moving junction during invasion. PLoS Pathog. 2009;5:e1000309. - PMC - PubMed
    1. Srinivasan P, Beatty WL, Diouf A, Herrera R, Ambroggio X, Moch JK, Tyler JS, Narum DL, Pierce SK, Boothroyd JC, Haynes JD, Miller LH. Binding of Plasmodium merozoite proteins RON2 and AMA1 triggers commitment to invasion. Proc Natl Acad Sci U S A. 2011;108:13275–13280. - PMC - PubMed
    1. Garner MM, Revzin A. A gel electrophoresis method for quantifying the binding of proteins to specific DNA regions: application to components of the Escherichia coli lactose operon regulatory system. Nucl Acids Res. 1981;9:3047–3060. - PMC - PubMed
    1. Engvall E, Perlmann P. Enzyme-linked immunosorbent assay (ELISA). Quantitative assay of immunoglobulin G. Immunochemistry. 1971;8:871–874. - PubMed

Publication types