. 2012 Dec 21;151(7):1417-30.
doi: 10.1016/j.cell.2012.11.022.

MeCP2 binds to 5hmC enriched within active genes and accessible chromatin in the nervous system

Affiliations

MeCP2 binds to 5hmC enriched within active genes and accessible chromatin in the nervous system

Marian Mellén et al. Cell. .

Abstract

The high level of 5-hydroxymethylcytosine (5hmC) present in neuronal genomes suggests that mechanisms interpreting 5hmC in the CNS may differ from those present in embryonic stem cells. Here, we present quantitative, genome-wide analysis of 5hmC, 5-methylcytosine (5mC), and gene expression in differentiated CNS cell types in vivo. We report that 5hmC is enriched in active genes and that, surprisingly, strong depletion of 5mC is observed over these regions. The contribution of these epigenetic marks to gene expression depends critically on cell type. We identify methyl-CpG-binding protein 2 (MeCP2) as the major 5hmC-binding protein in the brain and demonstrate that MeCP2 binds 5hmC- and 5mC-containing DNA with similar high affinities. The Rett-syndrome-causing mutation R133C preferentially inhibits 5hmC binding. These findings support a model in which 5hmC and MeCP2 constitute a cell-specific epigenetic mechanism for regulation of chromatin structure and gene expression.


Figures

Figure 1
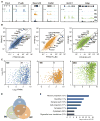
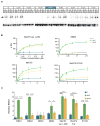
Figure 1. Cell type specific gene expression in cerebellar cell types by TRAP-Seq
(A) Visualization of FPKM values of TRAP-Seq data of various examples in PC, GC and BG. Pcp4 and Pvalb are enriched in PC (blue), Neurod2 and Calb2 are enriched in GC (orange) and Gstm1 and Gfap are enriched in BG (green). Values of RNA sequencing for these genes from total cerebellum (black) are also shown for comparison. Scale (minimum-maximum) is indicated on the top left corner of PC line for each gene. Windows show the following locations: Pcp4 chr16:96,683,159–96,757,502; Pvalb chr15:78,019,548–78,036,586 ; Neurod2 chr11:98,186,324–98,191,364; Calb2 chr8:112,663,312–112,696,669; Gstm1 chr3:107,814,027–107,821,968; Gfap chr11:102,746,534–102,760,963. (B) Scatter plots comparing FPKM of TRAP-Seq of an individual cell type [y-axis; blue (left) PC, orange (center) GC, green (right) BG] vs the averaged values of the other two (x-axis). Remarked dots in each panel represent genes enriched in each cell type (PC blue, GC orange and BG green) as previously described by microarray analysis in the literature. Genes in bold indicate the reporter gene of each cell type (n=4 per cell type) (C) Gene distribution showing enrichment (y-axis; Log2 FC: fold change) and expression values (Log2 FPKM) of enriched genes (> 2 FC) of each cell type compared individually with the other two, and averaged. The number of genes represented are indicated on the top left corner. Intensity of the color represents the level of enrichment. Grey bars delimit genes that are highly enriched (horizontal, cut off: 15 fold) and medium to highly expressed (vertical, cut off: 6 FPKM). (D) Venn diagram of the 250 most expressed genes of each cell type. (E) GO analysis of the 94 most expressed genes in PC that are not highly expressed in GC or BG as shown in panel D, p-val cut off 0.05. In parenthesis, percentage of genes that are included in each term. GO terms that explain the main biological features of PCs are highlighted in blue.
Figure 2
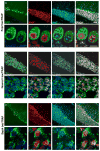
Figure 2. 5hmC is enriched in euchromatin in mature cerebellar cells
(A) (B) (C) Inmunohistochemistry in cerebellar sections showing the enriched distribution of 5hmC and 5mC. Upper panels: Confocal microscopy image of the granule cell layer of the cerebellum from a Pcp2 bacTRAP (+/−) (A), Neurod1 bacTRAP (+/−) (B) and Sept4 bacTRAP (+/−) (C) expressed in PC, GC and BG respectively. GFP expression (green), and inmunostaining for 5hmC (red) and 5mC (cyan) are shown. Scale bar, 50 μm. Lower panels: Magnification of these areas delimited by dotted lines in A, B and C respectively. In the 3 first panels also DAPI staining in blue is shown. Scale bar, 10 μm.
Figure 3
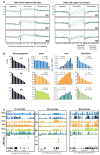
Figure 3. The relationship between cytosine methylation status and gene expression levels is cell specific
(A) Metagene profiles of 5hmC and 5mC. Each line represents percentage of genes ranked according the expression levels. (B) Genes were ranked by expressionand grouped in deciles (from 1, higher to 10, lower). FPKM of gene expression, and their correspondent FPKM of 5hmC, 5mC and the ratio between the two, averaged from single genes, are shown per cell type. Last column of 5hmC and 5mC histograms show averaged FPKM values of non-expressed (ne) genes. Pearson correlation coefficient (r) between expression and feature and p values are shown. (C) Representative examples of individual genes and their values of 5hmC, 5mC and gene expression from the three cell types. Left panel shows Pcp4, enriched in PCs. Middle panel shows Etv1, enriched in GCs and right panel shows Gfap, enriched in BG. In each panel, values from PCs are colored in blue, GCs in orange and BG in green. First line of each group indicates 5hmC normalized values and second, 5mC. Below, TRAP-Seq normalized values are shown per each cell type. The last line in black represents the gene bodies located in this particular region of the genome.
Figure 4
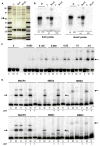
Figure 4. MeCP2 is the major protein that binds 5hmC
(A) Silver stained SDS-PAGE gel of nuclear proteins from frozen rat cerebella that bound beads coated with unmodified C, 5mC or 5hmC DNA. Arrow pointing at the band that was excised and identified by MS from a Coomassie stained replica gel. (B) Southwestern blot of the nuclear proteins from cerebella of WT or KO mice (IN) that bound to C or 5hmC- coated beads probed with radioactive 5mC or 5hmC DNA. (C) EMSA of C, 5mC (M) or 5hmC (H) probes with increasing concentrations (0 to 2 pmol) of recombinant human MeCP2. The arrow points at the MeCP2-dependent low-mobility complexes. (D) EMSA of C, 5mC (M) and 5hmC (H) probes in presence of 1 pmol of MeCP2 (aa 1-205), 1.2 pmol of MBD1, 0.5 pmol of MBD2, 50 pmol of MBD3 or 2.5 pmol of MBD4. The probes were either reacted with βGT prior to labeling or not (βGT−). Arrows point at protein-dependent DNA complexes.
Figure 5
Figure 5. R133C mutation of MeCP2 preferentially disrupts its binding to 5hmC
(A) The EMSA showing 5hmC binding characteristics of several MeCP2 point mutations (0.5 (1X) or 1 (2X) pmol) observed in RTT patients. Arrow shows the expected position of theMeCP2-dependent complexes. (B) Steady-state binding curves of MeCP2 (aa 1-205), MBD2, MeCP2 and MeCP2 R133C to C, 5mC and 5hmC reported as SPR response of Fcs immobilized with indicated probes upon application of serial dilutions of proteins. MeCP2 binding to both 5mC and 5hmC (upper left panel) shows specificity. MBD2 is chosen to represent the characteristic curve of 5mC-specificity (upper right panel). Full-length MeCP2 also binds 5hmC and 5mC with similar affinities and R133C mutation of MeCP2 shows nonspecific binding to 5hmC. (C) The extracted Bmax values, normalized for the protein mass, , of MBD family of proteins, MeCP2 (1-205), full length MeCP2 and R133C mutants. (n=4, SD). **** p-val< 0.0001; *** p-val<0.001; ** p-val<0.01; * p-val< 0.05 in F test to compare variances.
Figure 6
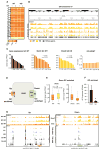
Figure 6. 5hmC levels over gene bodies do not change in MeCP2 KO
(A) Heatmap of 5hmC FPKM over the chromosomes. Both replicas from wild type (WT) and Mecp2-null (KO) animals are shown. (B) Chromosome 10 showing the levels of 5hmC and RNA-Seq in WT and KO animals. (C) Genes were ranked by expression and grouped in deciles. FPKM of gene expression in GC, and their correspondent FPKM of 5hmC in the GC WT, in the GC KO and the average fold change (FC) of each decile are shown. Pearson correlation coefficient (r) between expression and feature and p values are shown. * p-val <0.05 (D) Venn diagram of the dysregulated genes in KO. 36 genes from the upregulated genes are expressed in GC, 3 are enriched (> 2 FC) over PC and BG. 268 genes are downregulated and expressed in GC, 24 of them are enriched (> 2 FC) over PC and BG. (E) Box and whisker plots of 5hmC and 5mC levels of the 24 downregulated genes enriched in GC (left panel) and 5hmC in WT and KO GC (right panel). Wilcoxon signed-rank test coefficient (z) and p values are shown. * p-val <0.05. (F) Average of expression of the 24 downregulated genes enriched in GC and 3 upregulated genes enriched in GC. SE is shown. * p-val <0.05 in t-test. (G) Examples of dysregulated genes in the KO and enriched in GCs. 5hmC, 5mC and gene expression values are represented. Left panel shows Cgnl1 in red upregulated in KO (RNA-Seq values from WT in black and KO in grey). Right panel shows Ndufa5 in green downregulated in KO. In each panel, values from PCs are colored in blue, GCs in orange and BG in green. First line of each panel indicates GC WT 5hmC, second GC KO 5hmC, third, 5mC. Below, TRAP-Seq are shown per each cell type.
Figure 7
Figure 7. 5hmC and MeCP2 and the organization of neuronal chromatin
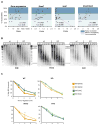
(A) Nuclei were digested with MNase for 5 min,and analyzed by qPCR. The correlation between the chromatin accessibility of individual genes and expression, 5hmC, 5mC and 5hmC/5mC (fourth panel) are shown (n=3) (B) Ethidium Bromide (EtBr) stained 2% agarose gel showing DNA fragments at different time points during MNase digestion (1–32 min) of nuclei from cerebella of WT or KO mice. The blotted gel that was probed with 5hmC or 5mC antibodies. (C) The precent intensity in high molecular weight DNA (HMW) in (B) was plotted as a function of time. Upper panels show the comparison in 5hmC and 5mC in the WT (left panel) and in MeCP2 KO (right panel). Lower panels show the comparison between WT and MeCP2 KO in 5hmC and 5mC. * p-val <0.05 in an unpaired T-test.

Comment in

Similar articles

Cited by

References

    1. Adkins NL, Georgel PT. MeCP2: structure and functionThis paper is one of a selection of papers published in a Special Issue entitled 31st Annual International Asilomar Chromatin and Chromosomes Conference, and has undergone the Journal, As usual peer review process. Biochemistry and Cell Biology. 2011;89(1):1–11. - PubMed
    1. Amir RE, I, Van den Veyver B, et al. Rett syndrome is caused by mutations in X-linked MECP2, encoding methyl-CpG-binding protein 2. Nat Genet. 1999;23(2):185–188. - PubMed
    1. Anders S, Huber W. Differential expression analysis for sequence count data. Genome Biol. 2010;11:R106. - PMC - PubMed
    1. Bebbington A, Anderson A, Ravine D, Fyfe S, Pineda M, de Klerk N, Ben-Zeev B, Yatawara N, Percy A, Kaufmann WE, et al. Investigating genotype-phenotype relationships in Rett syndrome using an international data set. Neurology. 2008;70:868–875. - PubMed
    1. Ben-Shachar S, Chahrour M, Thaller C, Shaw CA, Zoghbi HY. Mouse models of MeCP2 disorders share gene expression changes in the cerebellum and hypothalamus. Hum Mol Genet. 2009;18:2431–2442. - PMC - PubMed

Publication types

Associated data