. 2013 Feb 8;288(6):4436-51.
doi: 10.1074/jbc.M112.402123. Epub 2012 Dec 20.

Metabolism of 1-methyl-4-phenyl-1,2,3,6-tetrahydropyridine by mitochondrion-targeted cytochrome P450 2D6: implications in Parkinson disease

Affiliations

Metabolism of 1-methyl-4-phenyl-1,2,3,6-tetrahydropyridine by mitochondrion-targeted cytochrome P450 2D6: implications in Parkinson disease

Prachi Bajpai et al. J Biol Chem. .

Abstract

1-Methyl-4-phenyl-1,2,3,6-tetrahydropyridine (MPTP) is a neurotoxic side product formed in the chemical synthesis of desmethylprodine opioid analgesic, which induces Parkinson disease. Monoamine oxidase B, present in the mitochondrial outer membrane of glial cells, catalyzes the oxidation of MPTP to the toxic 1-methyl-4-phenylpyridinium ion (MPP(+)), which then targets the dopaminergic neurons causing neuronal death. Here, we demonstrate that mitochondrion-targeted human cytochrome P450 2D6 (CYP2D6), supported by mitochondrial adrenodoxin and adrenodoxin reductase, can efficiently catalyze the metabolism of MPTP to MPP(+), as shown with purified enzymes and also in cells expressing mitochondrial CYP2D6. Neuro-2A cells stably expressing predominantly mitochondrion-targeted CYP2D6 were more sensitive to MPTP-mediated mitochondrial respiratory dysfunction and complex I inhibition than cells expressing predominantly endoplasmic reticulum-targeted CYP2D6. Mitochondrial CYP2D6 expressing Neuro-2A cells produced higher levels of reactive oxygen species and showed abnormal mitochondrial structures. MPTP treatment also induced mitochondrial translocation of an autophagic marker, Parkin, and a mitochondrial fission marker, Drp1, in differentiated neurons expressing mitochondrial CYP2D6. MPTP-mediated toxicity in primary dopaminergic neurons was attenuated by CYP2D6 inhibitor, quinidine, and also partly by monoamine oxidase B inhibitors deprenyl and pargyline. These studies show for the first time that dopaminergic neurons expressing mitochondrial CYP2D6 are fully capable of activating the pro-neurotoxin MPTP and inducing neuronal damage, which is effectively prevented by the CYP2D6 inhibitor quinidine.


Figures
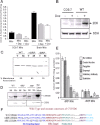
FIGURE 1.
FIGURE 1.
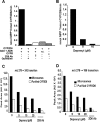
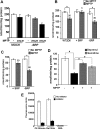
Oxidation of MPTP by mitochondrial and ER-targeted human CYP2D6. A, MAO activities of mitochondrial preparations from COS-7 cells mock-transfected with Dox-inducible lentiviral vector and mouse brain mitochondria. Metabolism of kynuramine to 4-hydroxyquinoline was carried out as described under “Materials and Methods” using isolated mitochondria. Mitochondria (Mito) were preincubated with or without added inhibitors (deprenyl (Dep) or chlorgyline (Clor), 20 μm each) for 10 min on ice before starting the assay. Means ± S.E. are shown (n = 3). B, immunoblots of whole cell extracts (50 μg each) from COS-7 cells expressing WT CYP2D6 treated with or without Dox (to induce CYP2D6). The blot was also developed with antibody to succinate dehydrogenase (SDH) to assess loading levels. C, ER membrane integration assay; the SRP binding affinities of WT, +SRP, and −SRP proteins were performed as described under “Materials and Methods.” The method essentially tests the extent of integration of labeled nascent proteins into unwashed canine pancreatic ER membrane. T, total translation product used in the assay; M, proteins bound to the ER membrane fraction that was re-isolated and washed. Proteins were analyzed by SDS-PAGE and subjected to autoradiography. Radiometric analysis was performed to determine the percentage of the total translation product that associated with the ER membrane for each construct. D, mitochondrial (Mt) and microsomal (Mc) CYP2D6 levels in WT, −SRP, and +SRP CYP2D6-expressing cells (induced with Dox). A rat liver microsomal (Micro) sample was used as a positive control. Proteins (30 μg each) were subjected to immunoblot analysis as described under “Materials and Methods.” The blot was developed with a monoclonal antibody to human CYP2D6 (1:1000 dilution, v/v) and co-developed with NPR antibody (1:1500 dilution, v/v) to assess levels of microsomal contamination of mitochondrial preparations. E, oxidation of MPTP by mitochondria from Dox-induced COS-7 cells expressing −SRP and +SRP CYP2D6. The oxidation products were quantified by nano-LC-MS-MS analysis as described under “Materials and Methods.” A standard curve of MPP+ was used to calculate moles of MPP+ formed per mg of protein. Inhibition studies were performed by preincubating enzymes for 20 min on ice with 10 μl of CYP2D6 inhibitory antibody or control ascites protein (10 mg/ml, BD Gentest, BD Biosciences) or 10 μm quinidine and 10 μm pargyline and 10 μm deprenyl at 37 °C for 20 min. F, schematic representation of WT2D6 and its mutant constructs. Mutated amino acids are underlined.
FIGURE 2.
FIGURE 2.
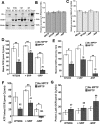
Oxidation of MPTP and bufuralol by purified CYP2D6 reconstituted with Adx and AdxR. CYP2D6-purified enzyme was reconstituted with mitochondrial electron transfer proteins, Adx and AdxR, or microsomal electron transfer protein NPR in the presence or absence of added inhibitors as described under “Materials and Methods.” A, levels of MPP+ formed were quantified using an LC-MS method as described under “Materials and Methods.” The control sample in A was treated with 10 μl of ascites fluid (10 mg/ml), and the corresponding control without treatment with ascites is presented in B. In the indicated reactions, the CYP2D6 antibody was added at 10 μg/reaction, and quinidine was added at 10 μm. In the reaction marked “+/−”, Adr was omitted from the assay mixture. The value for MPP+ formed in each case represents the mean ± S.E. for three separate estimates. B, effects of increasing concentrations of deprenyl (5 and 10 μm) on MPTP metabolism was tested. In vitro reactions with purified CYP2D6 were run, and the MPP+ metabolite was quantified as described under “Materials and Methods.” C and D, microsomes from −SRP CYP2D6-expressing cells (200 μg each) and purified CYP2D6 reconstituted with Adx and Adr as in described in Fig. 1 and under “Materials and Methods” were used for bufuralol oxidation assays, and the products were subjected to LC/MS/MS analysis. The indicated concentrations of deprenyl were added to reactions. In one assay, 10 μg of CYP2D6 antibody was added. 1′-Hydroxybufuralol was monitored using two transitions, m/z 278 → 242 and m/z 278 → 186.
FIGURE 3.
FIGURE 3.
Effects of MPTP on Neuro-2A cells stably expressing different CYP2D6 cDNA constructs. A, mitochondrial (Mito) and microsomal (Micro) isolates from Neuro-2A cells stably transduced with adenoviral vector with cloned WT, −SRP, and +SRP CYP2D6 cDNAs were subjected to immunoblot analysis; 30 μg of protein was run in each lane. The blot was co-developed with NPR antibody and TOM20 antibody. B and C, relative levels of puromycin acetyltransferase mRNA, which is the selection marker for the isolation of transduced cells, and the levels of integrated puromycin acetyltransferase gene were quantified to assess the levels of integration of vector DNA in each cell line. Actin mRNA level was used as internal control for mRNA levels, and CcO Vb gene was used as internal control for DNA level. D–G, respiration profile was measured in 25,000 cells using Seahorse Bioscience XF24 extracellular analyzer. All parameters were analyzed using XF software and displayed as oxygen consumption rates (pmol O2/min/well). D, basal OCR accounts for base-line rates of oxygen consumption. Oligomycin (2 μg/ml), DNP (40 μm), and rotenone (1 μm) were injected through ports A–C respectively. E, DNP-mediated uncoupling generates maximal OCR. F and G, inhibition by oligomycin and rotenone corresponds to ATP-linked OCR and proton leak, respectively. The number above the bar in the histogram indicates % inhibition or elevation. Mean values ± S.D. were calculated based on three separate measurements. ** denotes p < 0.05; # denotes p < 0.001.
FIGURE 4.
FIGURE 4.
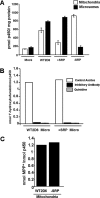
Cytochrome P450 contents and metabolic activities of mitochondrial and microsomal fractions from stable Neuro-2A cells. A, ferrous-CO versus ferrous difference spectra of mitochondria and microsomes of Neuro-2A cells. The P450 contents of mitochondrial and microsomal isolates were determined by using the dithionite-reduced and CO-bound difference spectra as described under “Materials and Methods.” B, bufuralol 1′-hydroxylation activity of microsomal 2D6 from WT and +SRP 2D6-expressing cells. Enzyme reconstitution and reaction conditions to ensure first-order rate kinetics were as described by Hanna et al. (17). Microsomes (Micro) from −SRP 2D6-expressing cells could not be used because of low CYP content. The values represent the mean of two separate estimates. Inhibition studies were performed by preincubating enzymes for 20 min on ice with 10 μl of 2D6 inhibitory antibody (10 mg of protein/ml, BD Gentest, BD Biosciences) or 10 μm quinidine and 10 μm pargyline at 37 °C for 20 min. C, MPTP oxidation by mitochondria from WT and −SRP 2D6-expressing Neuro-2A cells. Enzyme reconstitution was carried out as described under “Materials and Methods” in the presence of added Adx +Adr. Mitochondria from +SRP-expressing cells were not used because of lower than desirable levels of CYP content. The values represent means of duplicate reactions.
FIGURE 5.
FIGURE 5.
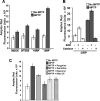
MPTP-mediated ROS production in Neuro-2A cells stably expressing CYP2D6. Stable Neuro-2A cells were grown with or without added MPTP (400 μm) and/or CYP2D6-specific inhibitor quinidine (10 μm) or a mitochondrion-specific antioxidant, mito-CP (0.5 μm). A, extracellular H2O2 levels were measured using the Amplex Red method as described under “Materials and Methods” in mock, WT2D6, +SRP, and −SRP cells. MPTP treatment (400 μm) was carried out for 48 h. B, effect of superoxide dismutase (SOD) and catalase on ROS in −SRP cells treated with or without MPTP C, effect of different inhibitors/antioxidant on ROS production in −SRP cells. 10 μm quinidine, deprenyl, and pargyline and 0.5 μm of mito-CP were used. MPTP treatment was as in A. Values represent the means ± S.E. of four separate assays.
FIGURE 6.
FIGURE 6.
Inhibition of mitochondrial complex I (NADH oxidoreductase) activity following exposure to MPTP. A and B, complex I activity was measured in mitochondria isolated from undifferentiated Neuro-2A cells (50 μg of protein each) treated with or without MPTP. Numbers over the bar diagram in B show % inhibition by added MPTP compared with the nontreated control cells. C, complex I activity was measured in mitochondria from differentiated Neuro-2A cells expressing different CYP2D6 cDNAs. Assays were run as in A. Effects of the CYP2D6-selective inhibitor quinidine (10 μm) and the MAO-B inhibitor deprenyl (10 μm) on complex I activity in mitochondria of −SRP cells were tested. D, inhibition of complex I in cells expressing −SRP 2D6. E, MAO activity was measured in mitochondria from rat liver, C6 glioma, and Neuro-2A cells using Amplex® Red monoamine oxidase assay kit, as per the manufacturer's protocol. Fluorometric assay of MAO-B was carried out using benzylamine as the substrate, based on the extent of inhibition by MAO-B inhibitor pargyline (10 μm). The activity was measured with 530 nm excitation and 590 nm emission. Results represent mean ± S.E. from three separate assays. * denotes p < 0.05 and # denotes p < 0.001.
FIGURE 7.
FIGURE 7.
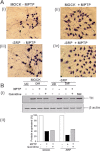
Effects of MPTP on the differentiation of Neuro-2A cells expressing mitochondrion-targeted CYP2D6. Neuro-2A cells were induced to differentiate for 72 h with 1 mm dibromo-cAMP. In some plates, MPTP (400 μm) was added after 24 h of differentiation. At the end of treatment, cells were fixed in ice-cold methanol, stained with hematoxylin and eosin, and viewed through an Olympus upright microscope. A, effects of MPTP on differentiated state of Neuro-2A cells. Panels i and ii, mock-transfected cells, without and with MPTP, respectively. Panels iii and iv, −SRP CYP2D6-expressing cells treated without and with MPTP, respectively. B, immunoblot of whole cell extracts (50 μg each) with antibody to TH (1:2000 dilution, v/v) (Immuno StAR, Hudson, WI). Blots for cell lysate were co-developed with antibody to actin (1:5000 dilution, v/v; Abcam, Cambridge, MA) as loading control. Panel ii shows quantitation of the immunoblot probed with TH antibody. UD, undifferentiated; Diff, differentiated.
FIGURE 8.
FIGURE 8.
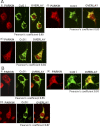
Effects of MPTP on mitochondrial localization of autophagy marker, Parkin. Immunofluorescence microscopy was carried out in differentiated Neuro-2A (Mock and −SRP cells) with and without added MPTP (400 μm) for 48 h and the CYP2D6-selective inhibitor quinidine (10 μm). Cells were incubated with a 1:1000 dilution (v/v) of primary anti-rabbit antibody to Parkin (Abcam, Cambridge, MA) and co-stained with a 1:500 dilution (v/v) of cytochrome oxidase I (anti-mouse) antibody as a mitochondrion-specific marker (Abcam, Cambridge, MA). The cells were subsequently incubated with Alexa 546-conjugated anti-rabbit and Alexa 488-conjugated anti-mouse IgG for colocalization of fluorescence signals. A, mock-transfected cells; B, −SRP 2D6-expressing cells. Panel i, cells with no MPTP treatment; panel ii, cells with added MPTP; panel iii, cells with added MPTP and quinidine. Numbers indicate Pearson coefficients calculated using Volocity 5.3 software.
FIGURE 9.
FIGURE 9.
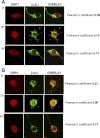
Effects of MPTP on the induction of Drp-1, a marker for mitochondrial fission. Immunofluorescence microscopy was carried out in differentiated Neuro-2A (mock and −SRP cells) with and without MPTP (400 μm) for 48 h as described in Fig. 7. Cells were incubated with a 1:250 dilution (v/v) of anti-rabbit DRP-1 antibody (Novus Biologicals, Littleton, CO) and co-stained with a 1:500 dilution (v/v) of cytochrome oxidase I (anti-mouse) antibody. The cells were subsequently incubated with Alexa 546-conjugated anti-rabbit and Alexa 488-conjugated anti-mouse IgG for co-localization of fluorescence signals. A, mock-transfected; B, −SRP CYP2D6-expressing cells. Panel i, cells with no MPTP treatment; panel ii, cells with MPTP treatment; panel iii, cells treated with MPTP and quinidine. Numbers indicate Pearson coefficients for co-localization, calculated using Volocity 5.3 software.
FIGURE 10.
FIGURE 10.
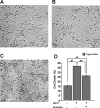
Effect of MPTP treatment on primary mouse brain neurons. Primary cortical neurons were seeded and grown for 8 days before treatment with MPTP and other agents for 48 h. Cell death was determined by trypan blue (0.4%) uptake by light microscopy (Nikon Eclipse TE 300) on ×20 magnification. A, trypan blue staining on neurons without any treatment; B, 50 μm MPTP treatment, and C, 50 μm MPTP plus 10 μm quinidine for 48 h. D, histogram representation of cell death (%) in control and treated groups. Isolation of primary neurons and counting methods were as described under “Materials and Methods.” Mean values ± S.E. were calculated based on three separate measurement. ** denotes p < 0.05; # denotes p < 0.001.
FIGURE 11.
FIGURE 11.
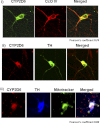
Mitochondrial CYP2D6 localization in primary dopaminergic neurons. Immunofluorescence microscopy was carried out as in Fig. 8 to identify localization of CYP2D6 in neuronal mitochondria. i, neurons were incubated with a 1:2000 dilution (v/v) of anti-mouse CYP2D6 antibody and co-stained with a 1:2000 dilution (v/v) of cytochrome oxidase subunit IVi1 (anti-rabbit) antibody. The cells were subsequently incubated with Alexa 488-conjugated anti-mouse and Alexa 546-conjugated anti-rabbit IgG for green and red fluorescence signals. ii, presence of CYP2D6 in dopaminergic neurons (TH) were detected by co-staining of anti-rabbit CYP2D6 (1:2000, Sigma) antibody (red) and anti-mouse tyrosine hydroxylase (1:1000) antibody (green). iii, triple staining was performed with anti-rabbit CYP2D6 antibody, Mitotracker Green (100 nm), and tyrosine hydroxylase antibody (blue) for verification of mitochondrial CYP2D6 localization. Numbers indicate Pearson coefficients for co-localization, calculated using Metamorph Advanced software.
FIGURE 12.
FIGURE 12.
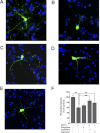
Effects of MPTP on dopaminergic neurons. Mesencephalic neurons cultured for 8 days were incubated with and without MPTP (50 μm) for 48 h. To assess the selective role of CYP2D6 in inducing MPTP-mediated toxicity, quinidine (10 μm), pargyline (5 μm), or deprenyl (10 μm) was added individually. Neurons were incubated with 1:1000 dilution of anti-mouse TH antibody, a marker for dopaminergic neurons and co-stained with DAPI (1 μg/ml). Emission from Alexa 488-conjugated anti-mouse IgG served as fluorescent signal. A, TH-stained dopaminergic neurons without treatment; B, neurons with MPTP treatment; C, neurons treated with MPTP and quinidine; D, neurons treated with MPTP and pargyline; E, neurons with MPTP and deprenyl (10 μm). F, presence of TH-positive neurons with treatments was determined as percentage of control (no treatment). Mean values ± S.E. was calculated based on three separate measurements. ** denotes p < 0.05.
FIGURE 13.
FIGURE 13.
Proposed new model for MPTP-mediated neurodegeneration.

Similar articles

Cited by

References

    1. Kopin I. J., Markey S. P. (1988) MPTP toxicity. Implications for research in Parkinson disease. Annu. Rev. Neurosci. 11, 81–96 - PubMed
    1. Meredith G. E., Sonsalla P. K., Chesselet M. F. (2008) Animal models of Parkinson disease progression. Acta Neuropathol. 115, 385–398 - PMC - PubMed
    1. Sonsalla P. K., Heikkila R. E. (1986) The influence of dose and dosing interval on MPTP-induced dopaminergic neurotoxicity in mice. Eur. J. Pharmacol. 129, 339–345 - PubMed
    1. Chiba K., Trevor A., Castagnoli N., Jr. (1984) Metabolism of the neurotoxic tertiary amine, MPTP, by brain monoamine oxidase. Biochem. Biophys. Res. Commun. 120, 574–578 - PubMed
    1. Chiba K., Peterson L. A., Castagnoli K. P., Trevor A. J., Castagnoli N., Jr. (1985) Studies on the molecular mechanism of bioactivation of the selective nigrostriatal toxin 1-methyl-4-phenyl-1,2,3,6-tetrahydropyridine. Drug Metab. Dispos. 13, 342–347 - PubMed

Publication types

MeSH terms

LinkOut - more resources