. 2013 Feb;87(4):2307-19.
doi: 10.1128/JVI.02014-12. Epub 2012 Dec 12.

Host cell autophagy modulates early stages of adenovirus infections in airway epithelial cells

Affiliations

Host cell autophagy modulates early stages of adenovirus infections in airway epithelial cells

Xuehuo Zeng et al. J Virol. 2013 Feb.

Abstract

Human adenoviruses typically cause mild infections in the upper or lower respiratory tract, gastrointestinal tract, or ocular epithelium. However, adenoviruses may be life-threatening in patients with impaired immunity and some serotypes cause epidemic outbreaks. Attachment to host cell receptors activates cell signaling and virus uptake by endocytosis. At present, it is unclear how vital cellular homeostatic mechanisms affect these early steps in the adenovirus life cycle. Autophagy is a lysosomal degradation pathway for recycling intracellular components that is upregulated during periods of cell stress. Autophagic cargo is sequestered in double-membrane structures called autophagosomes that fuse with endosomes to form amphisomes which then deliver their content to lysosomes. Autophagy is an important adaptive response in airway epithelial cells targeted by many common adenovirus serotypes. Using two established tissue culture models, we demonstrate here that adaptive autophagy enhances expression of the early region 1 adenovirus protein, induction of mitogen-activated protein kinase signaling, and production of new viral progeny in airway epithelial cells infected with adenovirus type 2. We have also discovered that adenovirus infections are tightly regulated by endosome maturation, a process characterized by abrupt exchange of Rab5 and Rab7 GTPases, associated with early and late endosomes, respectively. Moreover, endosome maturation appears to control a pool of early endosomes capable of fusing with autophagosomes which enhance adenovirus infection. Many viruses have evolved mechanisms to induce autophagy in order to aid their own replication. Our studies reveal a novel role for host cell autophagy that could have a significant impact on the outcome of respiratory infections.


Figures

Fig 1
Fig 1
Starvation-induced autophagy enhances early E1A protein expression and production of new viral progeny in acutely infected lung epithelial cells. (A) Human bronchial and alveolar epithelial cell models (16HBE14o- and A549, respectively) were cultured under nutrient-rich conditions (zero time point) or starved in EBSS up to 6 h to induce autophagy. Equal aliquots of total cellular protein were immunoblotted with antibodies to LC3 (top panels) and p62 (middle) to monitor autophagic flux and actin (bottom) to control for protein loading. (B) Unstarved (−) and EBSS-starved (+) 16HBE14o- cells were treated with vehicle (−) or 15 mM capric acid (C10) to disrupt tight junctions (+) for 5 min prior to Ad2 infection (MOI, 400). Equal protein aliquots were immunoblotted for E1A to monitor Ad early gene expression (top panels) and actin to control for protein loading (bottom panels). (C) A549 cells were infected with Ad2 under nutrient-rich conditions (unstarved) or after 3 h EBSS pretreatment. Lysates were collected at 8 h postinfection (p.i.) from cells infected with increasing Ad2 MOI for immunoblotting with E1A and actin antibodies. (D) Quantification of E1A expression data in unstarved (white bars) and starved (gray bars) cells infected with increasing Ad2 MOI (representative data in panel C). Data plotted as E1A/actin ratio with unstarved cells infected with an MOI of 50 set to 1 (left). These data were replotted with a scale range from 1 to 3 to highlight differences at low MOI (right). Bars represent the means ± standard error of the means (SEM) (n = 3); *, P < 0.01; **, P < 0.001. (E) Unstarved and EBSS-starved cells infected with an MOI of 100 (upper panels) or 400 (lower panels) were harvested hourly from 5 to 8 h p.i. for immunoblotting with E1A and actin antibodies. (F) Unstarved and starved cells infected with an MOI of 20 were harvested 24 h postinfection for quantification of double-stranded viral DNA as described in Materials and Methods. Ad2 DNA molecules/60-mm dish of infected cells were converted to Ad2 particles using the following conversion factor: 1 ng Ad2 DNA = 2.5 × 10⁷ viral particles. *, P = 0.00307. (G) Unstarved and EBSS-starved cells were harvested without Ad2 infection (left panels) or 5 to 20 min p.i. (right panels), and equal protein aliquots were immunoblotted with phospho-specific and activation-independent ERK1/2 antibodies.
Fig 2
Fig 2
Atg4b is required for enhanced E1A production in starved cells. (A and B) A549 cells were transfected with control (Cntl) and Atg4b-specific (A) or Rab7-specific (B) siRNAs for 72 h. Equal protein aliquots were immunoblotted with antibodies to monitor Atg4b or Rab7 expression (top panels) and actin (A) or tubulin (B) to control for protein loading (bottom). (C) Confocal images of A549 cells with stable LC3-GFP expression (green) transfected with Cntl, Atg4b-specific, or Rab7-specific siRNAs for 72 h stained with rhodamine-conjugated phalloidin (red) and DAPI (blue) to visualize actin and nuclei, respectively, under nutrient-rich conditions (unstarved) or following 3 h EBSS pretreatment. Bar, 5 μM. (D) Cells which had been transfected with Cntl, Atg4b-specific, or Rab7-specific siRNAs were cultured under nutrient-rich conditions (unstarved) or pretreated with EBSS for 3 h followed by Ad2 infection for 8 h (MOI, 400). Equal aliquots of total cellular protein were immunoblotted with antibodies to E1A (top) and actin (bottom). (E) Quantification of E1A expression data in Atg4b-depleted cells (representative data in panel D). Cells treated with Cntl (white bars), Atg4b (light-gray bars), or Rab7 (dark-gray bars) siRNAs were infected under nutrient-rich conditions (unstarved) or after a 3-h EBSS pretreatment. Data plotted as E1A/actin ratio with Cntl siRNA transfected cells under nutrient-rich conditions adjusted to 1. Bars represent the means ± SEM (n = 3). Bars exhibiting a statistically significant increase in E1A expression are marked with an asterisk, and those with a statistically significant reduction are marked with a number sign. All P values are <0.005.
Fig 3
Fig 3
Ad2 is detected in presumptive amphisomes in starved cells. (A) HEK-293 cells were cultured under nutrient-rich conditions (−) or treated with EBSS for 3 h to induce autophagy (+). Equal aliquots of total cellular protein were immunoblotted with antibodies to LC3 (top) and p62 (middle) to monitor autophagic flux and actin (bottom) to control for protein loading. (B) Unstarved (−) and starved (+) HEK-293 cells were refed with complete medium for up to 8 h to mimic conditions in Ad2-infected cells. Equal protein aliquots were immunoblotted with antibodies to E1A (top) and actin (bottom). (C and D) Histograms for cell surface expression of CAR (C) and αv integrin subunits (D) in A549 cells under nutrient-rich conditions (red) or following 3 h of EBSS pretreatment (green) detected by flow cytometry. Gray and black lines are background fluorescence associated with isotype-matched control antibodies as indicated in the figure. The y axis represents cell number, and the x axis is fluorescence intensity on a logarithmic scale. Representative of at least two independent measurements. (E, F, and F′) Confocal images of A549 cells with stable GFP-LC3 expression (green) infected with Ad2 (MOI, 400) for 30 min under nutrient-rich conditions (E) or after 3 h of EBSS starvation (F) stained with antibodies to EEA1 (blue) and Ad2 hexon (red) followed by fluorochrome-conjugated secondary antibodies (PE-tagged goat anti-rabbit and rhodamine red-X (RRX)-tagged goat anti-mouse antibodies, respectively). Magnified images of single and merged channels shown to the right of each panel. Arrowheads in panel E show EEA1+ vesicles associated with hexon signals. Arrows and asterisks in panel F show hybrid EEA1+/LC3+ compartments or EEA1/LC3+ compartments, respectively, associated with hexon signals. Panel F′ depicts a presumptive EEA1+/LC3+ amphisome with a mixture of LC3 and EEA1 (green and blue, respectively) on the outer membrane, an internal LC3+ vesicle corresponding to the inner membrane of an autophagosome, and an Ad2 particle (red) in the compartment lumen. (G) Confocal image of A549 cell with stable GFP-LC3 expression (green) after 3 h of EBSS starvation stained with EEA1 antibody followed by PE-tagged goat anti-rabbit antibody (blue). Magnified images of single and merged channels shown to the right. Arrows show hybrid EEA1+/LC3+ compartments. Bars, 5 μM.
Fig 4
Fig 4
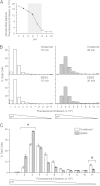
Autophagy modulates the pH environment of cointernalized dextran particles (MW, 10,000) during Ad2 infection. (A) The pH response profile of pHrodo dextran was monitored at excitation/emission wavelengths of 545/590 nm in a fluorescence microplate reader (n = 3 ± SEM). The pH range of 5 to 8, commonly seen as endocytic vesicles are acidified, is highlighted in gray. (B and C) Unstarved (white bars) and EBSS-starved (gray bars) cells were incubated with pHrodo dextran for 15 or 30 min in the absence of virus (B) or in the presence of Ad2 for 15 min (C). Cells were analyzed without fixation by flow cytometry using a 560/585 nm excitation/emission ratio. Data were binned in fluorescence excitation increments and presented as percentage of total cells within that excitation range. Numbers on the x axis indicate the end of each excitation range. For instance, the bars on the far left indicate the percentage of total cells with an excitation emission between 0 and 200. The schematics beneath each plot indicate that an increase in fluorescence emission correlates with a decrease in pH. Regions marked with an asterisk or a number sign in panel C are discussed in the text. (B) Representative of 3 independent measurements. (C) Data are the means of three determinations ± SEM.
Fig 5
Fig 5
Vps39 regulates Rab7 membrane recruitment. (A) Schematic showing dual roles for the Vps39 subunit of the HOPS (homotypic fusion and protein sorting) in the endocytic pathway. Together with the Mon/Ccz1 complex, which displaces the Rab5 effector Rabex5, Vps39 is required for Rab5 dissociation to cytosol, where it forms a complex with guanine nucleotide dissociation inhibitor (GDI). Rab5 release is coupled with acquisition and activation of Rab7 GTPase on late endosomal membranes. Vps39 is also required for late endosome-lysosome fusion (53). (B) A549 cells were transfected with Cntl or Vps39-specific siRNAs for 72 h. Vps39 mRNA levels were measured by quantitative PCR and normalized to an internal GAPDH internal control. Results are presented as fold decreases (means ± SEM; n = 3) relative to Vps39 mRNA expression in cells receiving Cntl siRNA, which was set to 1. *, P < 0.001. Knockdown was evaluated by quantitative PCR due to lack of suitable antibodies to endogenous Vps39. (C) Crude membrane fractions were collected from siRNA-transfected A549 cells harvested under basal conditions (−) or following 1 h EGF stimulation (+). Equal protein aliquots were immunoblotted with antibodies to Rab7 to monitor its acquisition by endosomal membranes (top) and transferrin receptor (TfR) to control for membrane protein loading (bottom). (D) Confocal image of A549 cells with stable GFP-Rab7 expression (green) stained with DAPI (blue) and Vps39 antibody (red) followed by RRX-tagged goat anti-rabbit secondary antibody. Magnified images of single and merged channels shown to the right. Arrows show vesicles with merged Rab7 and Vps39 signals. Bars, 5 μm. (E) siRNA-transfected A549 cells were stimulated with EGF (100 ng/ml) for the times indicated. Equal protein aliquots were immunoblotted with antibodies to EGFR to monitor ligand-induced receptor degradation (top) and tubulin to control for protein loading (bottom). (F) siRNA-transfected A549 cells were kept in nutrient-rich media (−) or incubated with EBSS for 3 h (+). Equal protein aliquots were immunoblotted with antibodies to LC3 (top) and p62 (middle) to monitor autophagic flux and actin to control for protein loading (bottom).
Fig 6
Fig 6
Vps39 regulates endosome maturation during ligand-induced EGFR trafficking. (A and B) siRNA-transfected cells were incubated with Alexa 488-EGF (green) for 30 min (A) or 1 h (B). Cells were fixed and costained with antibodies to EEA1 (red) and CD63 (blue) followed by fluorochrome-conjugated secondary antibodies (FITC-tagged goat anti-rabbit and PE-tagged goat anti-mouse, respectively). Magnified images of single and merged channels are shown to the right of each panel. Arrows in panel A show EGF colocalized with EEA1. Arrows in panel B show EGF+/CD63+ compartments, and dashed arrows indicate their relative positions in the single EEA1+ red channel. Arrowheads in panel B show hybrid EEA1+/CD63+ compartments containing EGF in Vps39-depleted cells. Bars, 5 μm. (C) Quantification of EEA1+/CD63+ hybrid compartments. LSM image files were converted to TIFF file format, and vesicles with colocalized markers were scored using MetaMorph software. Cntl siRNA, white bar (n = 102); Vps39 siRNA, light-gray bar (n = 98); Rab7 siRNA, dark-gray bar (n = 94); *, P < 0.0001. (D) Quantification of EGF+/LBPA+ vesicle size. LSM image files were opened in ImageJ software, and the LBPA vesicle size was analyzed after threshold values were set. Cntl siRNA, white bar (n = 6); Rab7 siRNA, dark-gray bar (n = 6); *, P = 0.0057.
Fig 7
Fig 7
Vps39 knockdown increases autophagy-induced enhancement of Ad2 infectivity. (A) A549 cells were transfected with Cntl or Vps39-specific siRNAs for 72 h. Cells were then infected with Ad2 for 8 h under nutrient-rich conditions (−) or after a 3-h EBSS starvation (+) (MOI, 400). Equal protein aliquots were immunoblotted with antibodies to E1A (top) and then actin (bottom). (B and C) Histograms for cell surface expression of CAR (B) and αv integrin subunits (C) in A549 cells treated with control (red) or Vps39 (green) siRNA detected by flow cytometry. Gray and black lines are background fluorescence associated with isotype-matched control antibodies as indicated. The y axis represents cell number, and the x axis is fluorescence intensity on a logarithmic scale. (D and E) Fluorescence emission profiles for cointernalized pHrodo dextran particles in unstarved (D) and EBSS-starved (E) cells under basal conditions (white bars) or following Vps39 siRNA knockdown (gray bars). Data were analyzed as described in Fig. 4. Regions marked with a number sign are discussed in the text. Representative data from two independent experiments. (F) Confocal images of A549 cells with stable GFP-LC3 expression (green) transfected with Cntl (upper panels) or Vps39-specific (lower panels) siRNAs for 72 h and then fixed and stained with an EEA1 antibody (red) followed by RRX-tagged goat anti-rabbit secondary antibody. Magnified images of single and merged channels are shown to the right. Arrows show examples of presumptive EEA1+/LC3+ amphisomes. Bars, 5 μm. (G) Quantification of EEA1+/LC3+ vesicles. Confocal images were collected from approximately 90 cells chosen at random, and the number of EEA1+/LC3+ vesicles in each cell was counted manually. Cntl siRNA, white bar (n = 81); Vps39 siRNA, light-gray bar (n = 96); *, P < 0.0001.
Fig 8
Fig 8
Summary model. Our data suggest Ad2 endosome release is regulated by host cell factors, such as Vps39, that regulate early-to-late endosome maturation. Ad traffics through Rab5+ early endosomes (red) and proceeds to an unknown compartment (pink) (A), avoiding transport to Rab7+ late endosomes (blue) via a classical early-to-late endosome maturation program (B) if it is not released to cytosol. The endosome population undergoing Rab5-Rab7 exchange (light purple) also appears to be a target for autophagosome fusion (C). The model predicts incoming Ad2 will be localized between an inner membrane derived from LC3+ (green) autophagosomes and an outer membrane with a mixture of autophagosomal and endosomal membranes (dark purple) after autophagosomes fuse with early endosomes. We favor a model where amphisomes increase the capacity for membrane penetration in cells with high levels of autophagy (C). However, autophagy may have multiple effects, which are discussed in the text, that are not necessarily mutually exclusive.

Similar articles

Cited by

References

    1. Horwitz M. 1995. Fields virology, 3rd ed Lippincott-Raven, Philadelphia, PA
    1. Paolino K, Sande J, Perez E, Loechelt B, Jantausch B, Painter W, Anderson M, Tippin T, Lanier ER, Fry T, DeBiasi RL. 2011. Eradication of disseminated adenovirus infection in a pediatric hematopoietic stem cell transplantation recipient using the novel antiviral agent CMX001. J. Clin. Virol. 50:167–170 - PubMed
    1. Bachtarzi H, Stevenson M, Fisher K. 2008. Cancer gene therapy with targeted adenoviruses. Expert Opin. Drug Deliv. 5:1231–1240 - PubMed
    1. Franz A, Adams O, Willems R, Bonzel L, Neuhausen N, Schweizer-Krantz S, Ruggeberg JU, Willers R, Henrich B, Schroten H, Tenenbaum T. 2010. Correlation of viral load of respiratory pathogens and co-infections with disease severity in children hospitalized for lower respiratory tract infection. J. Clin. Virol. 48:239–245 - PMC - PubMed
    1. Ginsberg H. 1996. The ups and downs of adenovirus vectors. Bull. N. Y. Acad. Med. 73:53–58 - PMC - PubMed

Publication types

LinkOut - more resources