. 2013 Jul;6(4):847-56.
doi: 10.1038/mi.2012.123. Epub 2012 Dec 12.

Retinoic acid regulates the development of a gut-homing precursor for intestinal dendritic cells

Affiliations

Retinoic acid regulates the development of a gut-homing precursor for intestinal dendritic cells

R Zeng et al. Mucosal Immunol. 2013 Jul.

Abstract

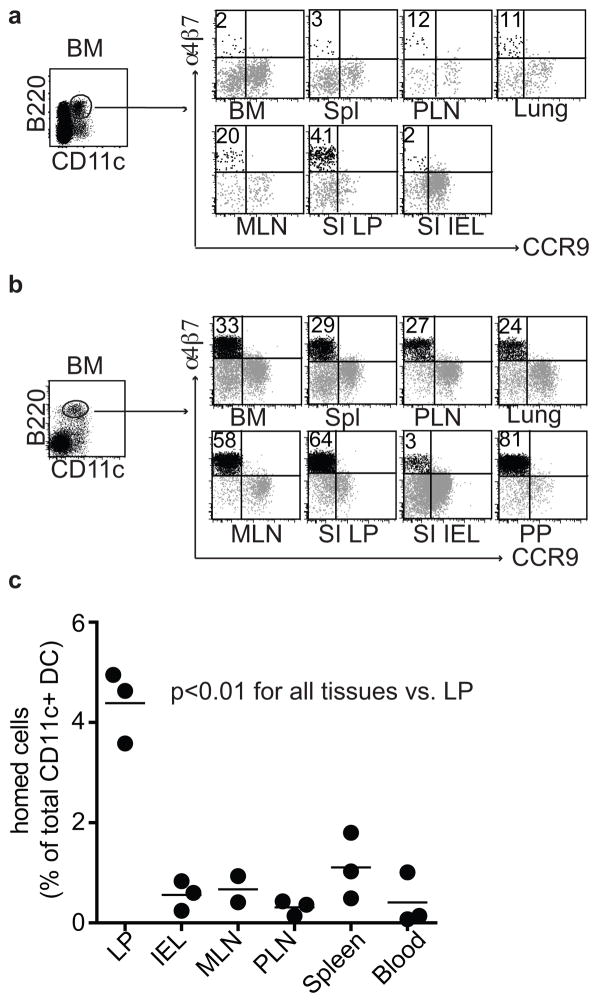
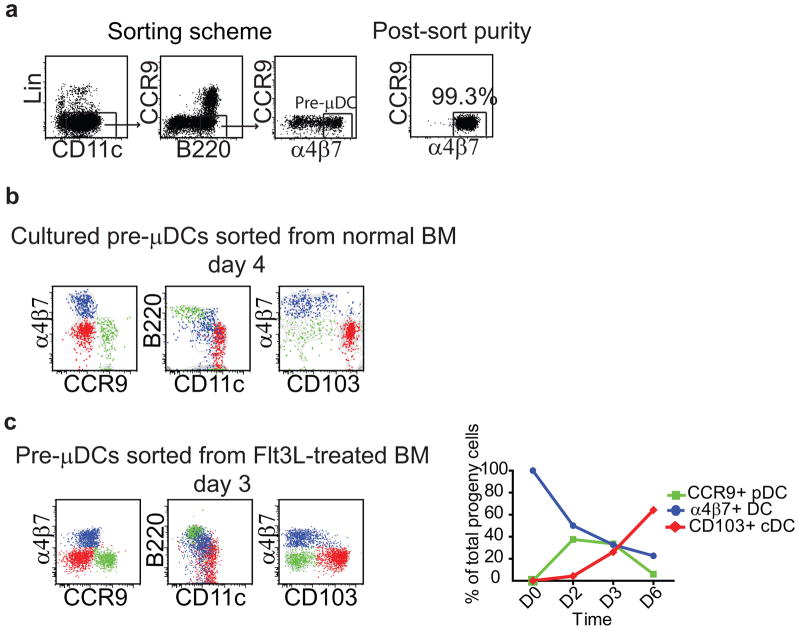
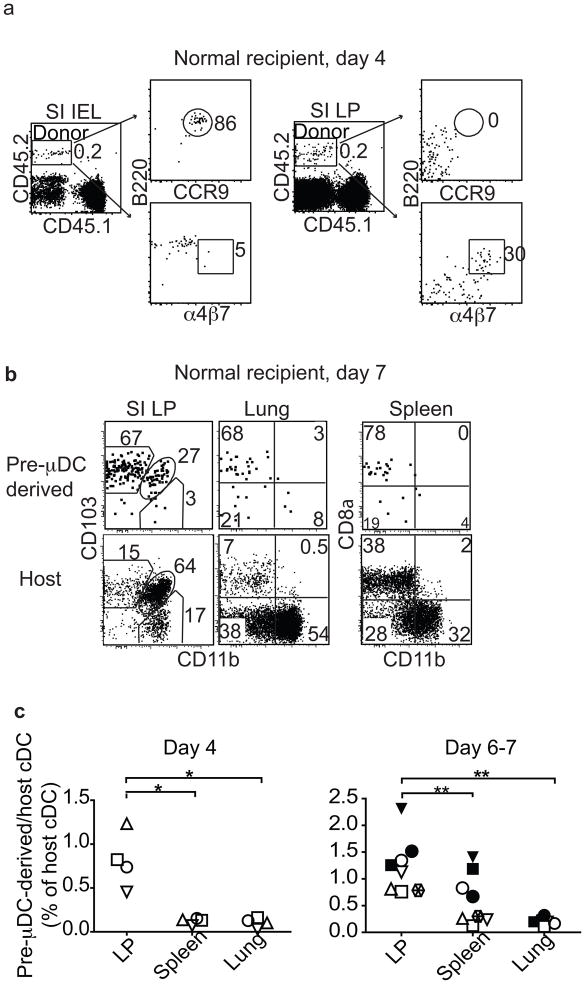
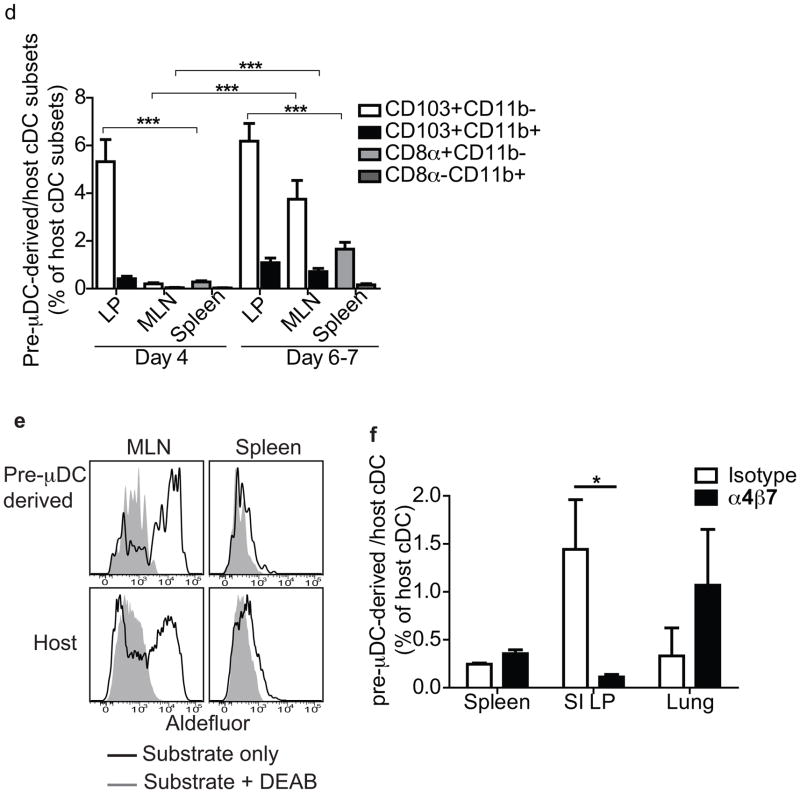
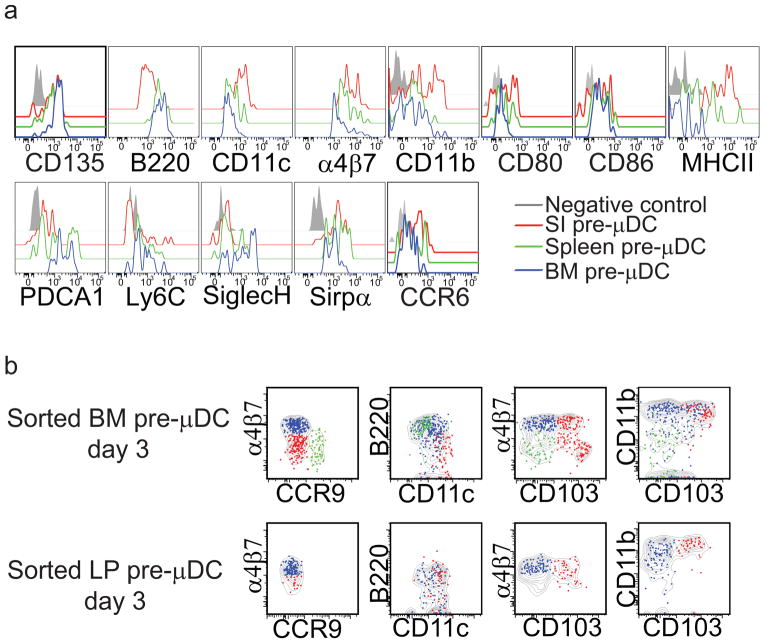
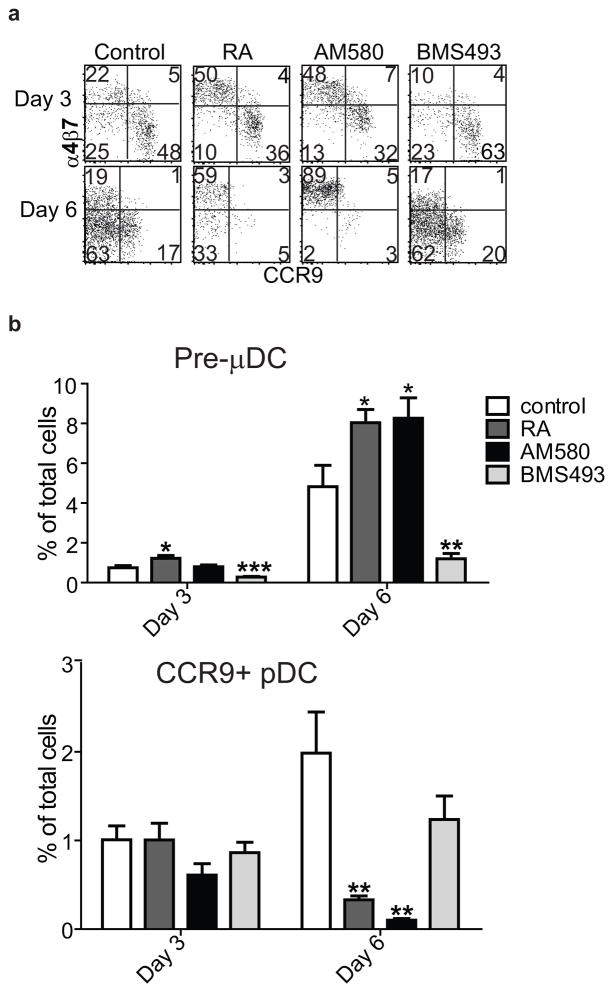
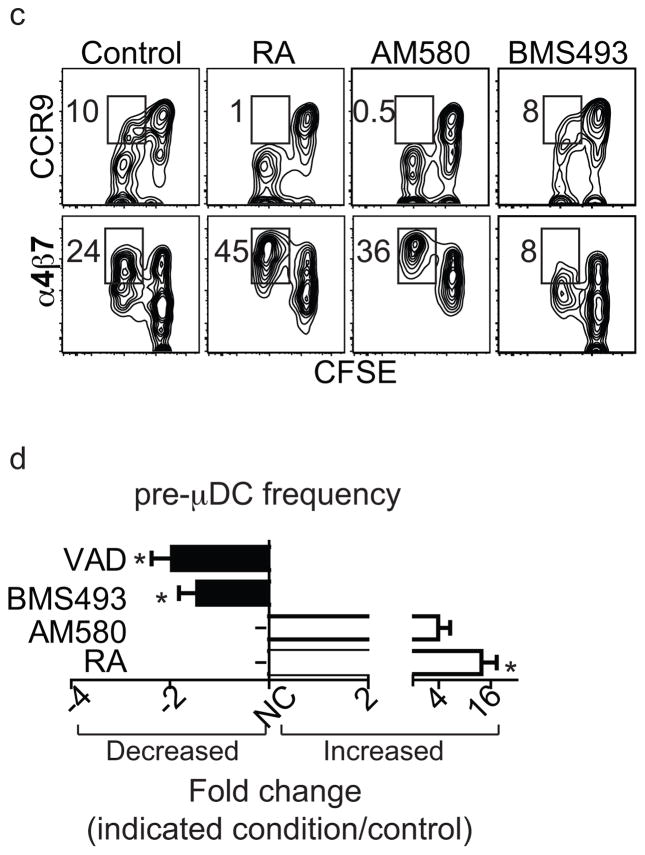
The vitamin A metabolite retinoic acid (RA) regulates intestinal immune responses through immunomodulatory actions on intestinal dendritic cells (DCs) and lymphocytes. Here, we show that RA also controls the generation of gut-tropic migratory DC precursors, referred to as pre-mucosal DCs (pre-μDCs). Pre-μDCs express the gut trafficking receptor α4β7 and home preferentially to the intestines. They develop in the bone marrow (BM), can differentiate into CCR9⁺ plasmacytoid DCs as well as conventional DCs (cDCs), but preferentially give rise to CD103⁺ intestinal cDCs. Generation of pre-μDCs in vivo in the BM or in vitro is regulated by RA and RA receptor α (RARα) signaling. The frequency of pre-μDCs is reduced in vitamin A-deficient animals and in animals treated with RAR inhibitors. The results define a novel vitamin A-dependent, RA-regulated developmental sequence for DCs and identify a targeted precursor for CD103⁺ cDCs in the gut.


Conflict of interest statement

The authors declare no conflict of interest.

Figures

Figure 1
Figure 1. Identification of a phenotypically unique α4β7 expressing, gut-homing DC subset in vivo.
a) Surface expression of α4β7 and CCR9 on live lin CD11c+B220+ DCs from lymphoid and non-lymphoid tissues from 2–3 week old C57Bl/6 mice; lin indicates CD3, CD19, and NK1.1. Data are representative of seven independent experiments. b) Surface expression of α4β7 and CCR9 on live linCD11c+B220+ DCs from lymphoid and non-lymphoid tissues taken from Flt3L-treated mice. Data are representative of at least three independent experiments. c) Three million purified pre-μDCs, sorted from peripheral lymphoid tissues from Flt3L-treated B6.CD45.2 mice, were transferred intravenously into B6.CD45.1 recipients. Tissues were harvested on day 3 after transfer and donor-derived cells were quantified. Data are presented as the percentage of total CD11c+ host cells. Each dot represents 1 individual animal, n=3 from two independent experiments. p<0.01 for LP vs. all other tissues by Student’s t-test.
Figure 2
Figure 2. Pre-μDCs give rise to CCR9+ pDCs and to CD103+ cDCs in vitro
a) Sorting scheme and purity analysis for pre-μDCs. Lin indicates CD3, CD19, and NK1.1. b) Pre-μDCs were sorted from BM of B6.CD45.2 mice and cultured with total BM taken from congenic B6.CD45.1 mice in complete RPMI supplemented with 100 ng/ml rFlt3L. Cultured cells were analyzed by flow cytometry on day 4. Pre-μDC-derived cells on day 4 included three distinct populations: CCR9+ DCs (green), CD103+ DCs (red) and α4β7+ DCs (blue). Grey contour plots show all pre-μDC-derived cells. Data represent one of three independent experiments with similar results. c) Pre-μDCs were sorted from Flt3L-treated mouse BM and cultured in the conditions described in panel b legend. Pre-μDC derived cells on day 3 consist of three populations similar to those from untreated mice. Line graphs show that by day 6, most pre-μDC-derived CCR9+ pDCs disappeared and the cultures consisted mostly of CD103+ cDCs. Data are representative of three independent experiments with similar results.
Figure 3
Figure 3. Pre-μDCs give rise to CD103+ cDCs and to CCR9+ pDC in vivo and preferentially reconstitute the small intestine
One to 2.5 million FACS-sorted pre-μDCs (CD45.2) were injected into CD45.1 recipients and analyzed on day 4 and day 6 or 7. Day 4: n=4 from two independent experiments. Day 6 or 7: n=8 from five independent experiments. * p<0.05, ** p<0.01, *** p<0.001 by Student’s t-test. a) CCR9, α4β7 and B220 expression on total pre-μDC-derived cells (CD45.2) in SI IEL (left) and LP (right) on day 4 after transfer. Numbers indicate percentage cells. Data shown are from one of four recipients with similar results. b) CD103 and CD11b on pre-μDC-derived CD11c+ cells and host CD11c+ cells on day 7. The plot shows data from one of eight recipients with similar results. c) Pre-μDC-derived CD11c+ cells (per million input cells) as percentage of host CD11c+ cells in different tissues on day 4 and day 6 or 7. Symbols of the same shape and color represent tissues from the same animal. d) Pre-μDC-derived CD103+CD11b and CD103+CD11b+ cDCs from SI LP or MLN and CD8α+CD11b and CD8αCD11b+ cDCs from spleen are shown as percentage of the corresponding subset from the host on day 4 and day 6 or 7 after transfer. e) Aldefluor staining of pre-μDC-derived and host CD11c+ cDCs from MLN and spleen. Negative control staining in the presence of ALDH inhibitor DEAB is shown for comparison. Data are representative of three independent experiments with similar results. f) Pre-μDCs were sorted from Flt3L-treated mice and pre-incubated with 250 μg of either α4β7-blocking antibody (DATK32) or isotype control for 10 minutes at room temperature before transfer into congenic recipients. Recipient mice received 250 μg of α4β7-blocking antibody or isotype control every 12 hours and were sacrificed on day 4. Pre-μDC-derived total CD11c+ cells were calculated as percentage of host CD11c+ cells. Data show combined results from analyses of three mice from two independent experiments. Error bars show SEM. * p<0.05 by Student’s t-test.
Figure 4
Figure 4. SI pre-μDCs are more differentiated than BM pre-μDCs and have lost potential to give rise to CCR9+ pDCs
a) Surface antigen expression on pre-μDCs from the BM, spleen, and SI LP. b) pre-μDCs were FACS sorted from BM and SI LP and cultured with congenic total BM feeder cells in complete RPMI supplemented with 100 ng/ml rFlt3L. Cultures were analyzed by flow cytometry on day 3. Pre-μDC-derived subsets are coded as follows: green, CCR9+; blue, α4β7+; red, CD103+; grey contour plot indicates total pre-μDC-derived cells. Data are representative of two experiments with similar results.
Figure 5
Figure 5. Retinoic acid regulates pre-μDC development in the BM
a–b) Total BM cells were cultured in complete media supplemented with 100 ng/ml of Flt3L in the absence (control) or presence of 1 nM RA, 10 nM AM580 (an RARα agonist), or 100 nM BMS498 (a pan RAR inverse agonist). Cells were harvested on days 3 and 6 and stained for pre-μDC and CCR9+ pDC markers. a) Cells were gated on LinCD11c+B220+ (Lin indicates CD3, CD19, DX-5, Ter-119, Ly6G). Numbers in each quadrant indicate percent cells. b) Percent of pre-μDCs (top) and CCR9+ pDCs (bottom) on days 3 and 6 in total BM cultures, grown under the conditions described in panel a legend. Data show combined results from four independent experiments with n=6–8 for each condition. Error bars show SEM. * p<0.05, **p<0.01, ***p<0.001 compared to control by Student’s t-test. c) Total BM cells were labeled with CFSE and cultured as described in the panel a legend. Cultures were harvested on day 3 and cells were gated on LinCD11c+B220+. Numbers indicate percentage cells. d) Fold change of pre-μDC frequency in BM from mice treated with each indicated condition compared to control. VAD: vitamin A deficient mice, n=10, control: n=8; BMS493/AM580/RA: mice received BMS493 or vehicle (for 7–18 days, n=4 each), AM580 or vehicle (4–6 days, n=2) or RA or vehicle (4–6 days, n=3). Pre-μDC frequency (among total BM cells) was determined. The fold change in frequency in treated vs. control mice in each paired comparison was calculated, and is shown with SEM or (for AM580) range. * p<0.05 by Mann Whitney test between treated and control mice.

Similar articles

Cited by

References

    1. Annacker O, Coombes JL, Malmstrom V, et al. Essential role for CD103 in the T cell-mediated regulation of experimental colitis. J Exp Med. 2005 Oct 17;202(8):1051–1061. - PMC - PubMed
    1. Bogunovic M, Ginhoux F, Helft J, et al. Origin of the lamina propria dendritic cell network. Immunity. 2009 Sep 18;31(3):513–525. - PMC - PubMed
    1. Iwasaki A. Mucosal dendritic cells. Annu Rev Immunol. 2007;25:381–418. - PubMed
    1. Johansson-Lindbom B, Svensson M, Pabst O, et al. Functional specialization of gut CD103+ dendritic cells in the regulation of tissue-selective T cell homing. J Exp Med. 2005 Oct 17;202(8):1063–1073. - PMC - PubMed
    1. Silva MA. Intestinal dendritic cells and epithelial barrier dysfunction in Crohn’s disease. Inflamm Bowel Dis. 2009 Mar;15(3):436–453. - PubMed

Publication types

MeSH terms