. 2013 May 1;22(9):1370-86.
doi: 10.1089/scd.2012.0486. Epub 2013 Feb 4.

Umbilical cord blood-derived mesenchymal stem cells inhibit, but adipose tissue-derived mesenchymal stem cells promote, glioblastoma multiforme proliferation

Affiliations

Umbilical cord blood-derived mesenchymal stem cells inhibit, but adipose tissue-derived mesenchymal stem cells promote, glioblastoma multiforme proliferation

Keiko Akimoto et al. Stem Cells Dev. .

Abstract

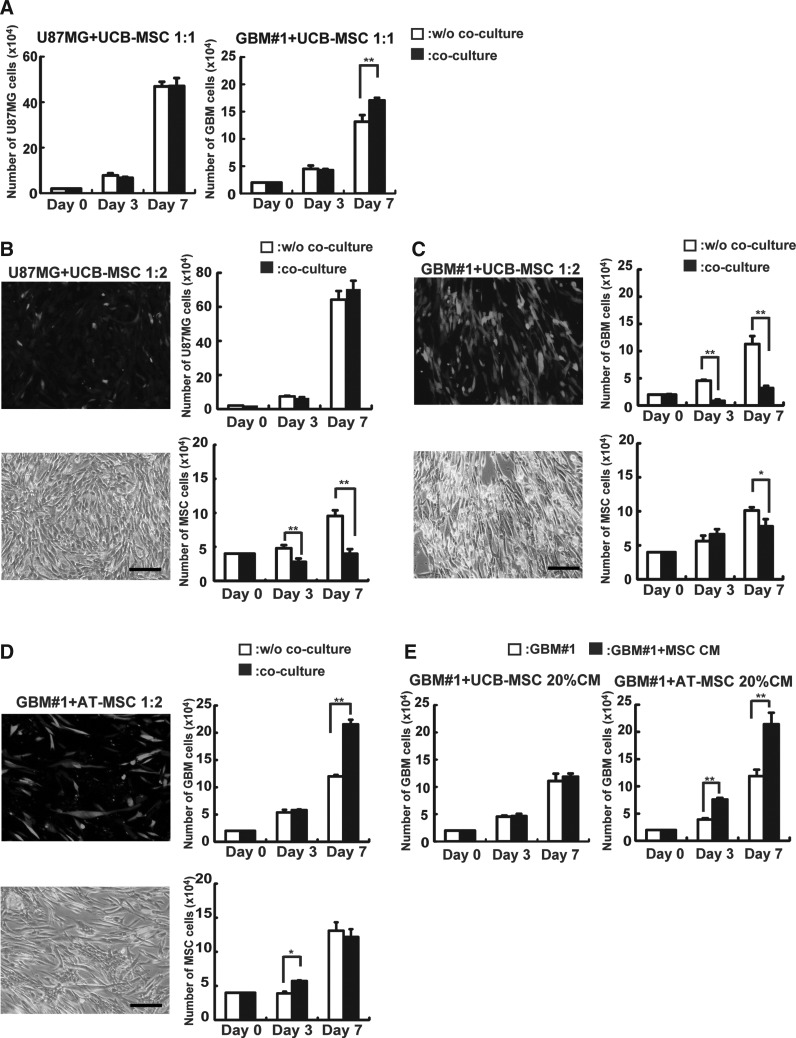
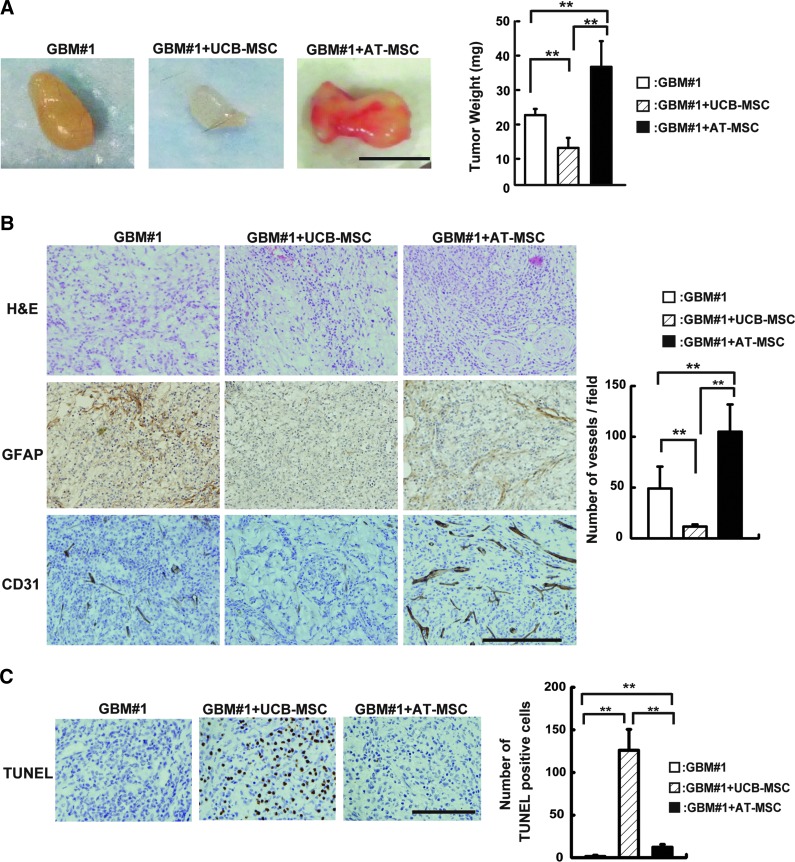
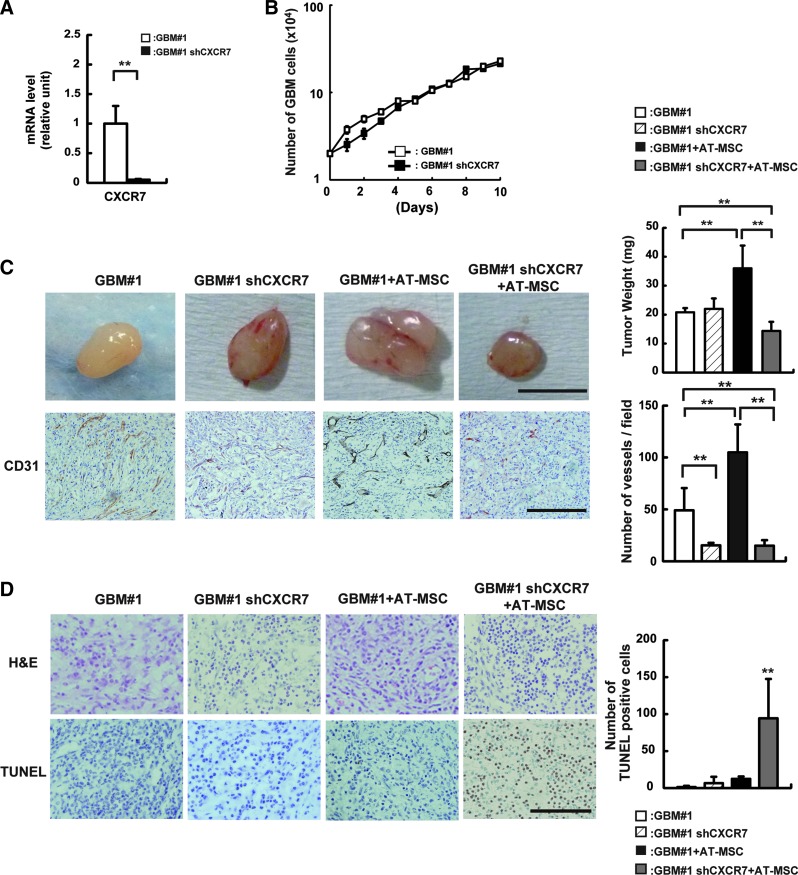
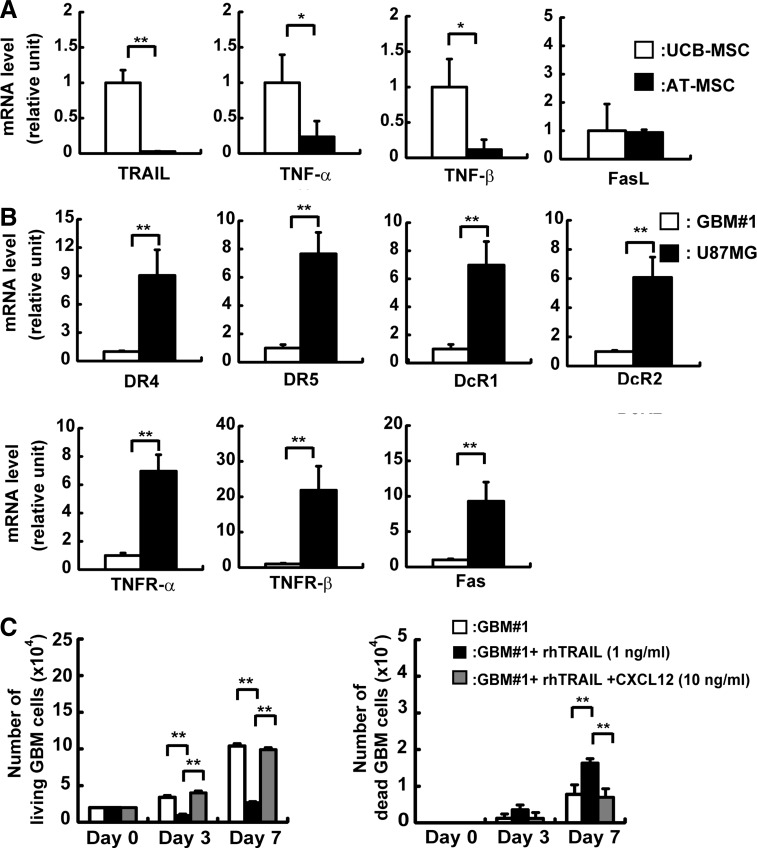
Mesenchymal stem cells (MSCs) possess self-renewal and multipotential differentiation abilities, and they are thought to be one of the most reliable stem cell sources for a variety of cell therapies. Recently, cell therapy using MSCs has been studied as a novel therapeutic approach for cancers that show refractory progress and poor prognosis. MSCs from different tissues have different properties. However, the effect of different MSC properties on their application in anticancer therapies has not been thoroughly investigated. In this study, to characterize the anticancer therapeutic application of MSCs from different sources, we established two different kinds of human MSCs: umbilical cord blood-derived MSCs (UCB-MSCs) and adipose-tissue-derived MSCs (AT-MSCs). We used these MSCs in a coculture assay with primary glioblastoma multiforme (GBM) cells to analyze how MSCs from different sources can inhibit GBM growth. We found that UCB-MSCs inhibited GBM growth and caused apoptosis, but AT-MSCs promoted GBM growth. Terminal deoxynucleotidyl transferase-mediated biotinylated UTP nick-end labeling assay clearly demonstrated that UCB-MSCs promoted apoptosis of GBM via tumor necrosis factor-related apoptosis-inducing ligand (TRAIL). TRAIL was expressed more highly by UCB-MSCs than by AT-MSCs. Higher mRNA expression levels of angiogenic factors (vascular endothelial growth factor, angiopoietin 1, platelet-derived growth factor, and insulin-like growth factor) and stromal-derived factor-1 (SDF-1/CXCL12) were observed in AT-MSCs, and highly vascularized tumors were developed when AT-MSCs and GBM were cotransplanted. Importantly, CXCL12 inhibited TRAIL activation of the apoptotic pathway in GBM, suggesting that AT-MSCs may support GBM development in vivo by at least two distinct mechanisms-promoting angiogenesis and inhibiting apoptosis. The opposite effects of AT-MSCs and UCB-MSCs on GBM clearly demonstrate that differences must be considered when choosing a stem cell source for safety in clinical application.


Figures

FIG. 1.
FIG. 1.
Isolation of primary glioblastoma multiforme (GBM) cells from patients. (A) Histological analysis was performed for GBM tissues by immunostaining. Specimens were stained with H&E: hematoxylin–eosin staining, glial fibrillary acidic protein (GFAP): astrocyte markers, CD31: endothelial markers, and MIB-1 (Ki-67): proliferation markers. Scale bar indicates 100 μm. (B) Adherent cells derived from GBM tissues were purified for nonhematopoietic (CD45-negative) and nonendothelial (CD31-negative) cells by fluorescence activated cell sorting (FACS). (C) CD45−/CD31− cells were purified and expanded for further experiments. Primary GBM cells (GBM#1) and U87MG showed fibroblastic morphology and expressed GFAP by immunostaining. Scale bar indicates 100 μm. (D) Growth activity was measured in primary GBM#1 and U87MG cells. Cells were harvested every 24 h until cells reached at a confluent state. The average cell number in triplicate dishes was determined (mean±SD). Note that the growth rate of U87MG (black squares) was faster than that of GBM#1 (white squares). (E) mRNA expression of each factor in GBM#1 and U87MG was examined by real-time polymerase chain reaction. White bar indicates GBM#1; black bar, U87MG. The mRNA expression seen in GBM#1 was normalized to a value of 1 as the standard for each factor (*P<0.05; **P<0.01). Color images available online at www.liebertpub.com/scd
FIG. 2.
FIG. 2.
Analysis of anti-GBM effects of mesenchymal stem cells (MSCs) in vitro. GBM cells (2×10⁴/well) were cocultured with MSCs (2×10⁴/well or 4×10⁴/well). After culture for 3 and 7 days, the number and frequency of GBM cells and green fluorescence protein (GFP)-labeled MSCs were measured by a hemocytometer and FACS. (A) U87MG and GBM#1 were cocultured with umbilical cord blood-derived MSCs (UCB-MSCs) at a ratio of 1:1. The left panel represents the number of U87MG and the right panel represents the number of GBM#1 in each time point. White bar: number of GBM alone w/o coculture; black bar: number of GBM cocultured with UCB-MSCs (**P<0.01). (B) U87MG were cocultured with UCB-MSCs at a ratio of 1:2. The left panel represents coculture of GFP-labeled UCB-MSCs with U87MG under fluorescence microscopy (top) and merged picture (bottom). Scale bar indicates 100 μm. The right panel represents the number of U87MG cells (top graph) cocultured with (black bar) or w/o GFP-labeled UCB-MSCs (white bar) and the number of UCB-MSCs (bottom graph) cocultured with (black bar) or w/o U87MG (white bar) (**P<0.01). (C) GBM#1 was cocultured with UCB-MSCs at a ratio 1:2. The left panel represents coculture of GFP-labeled UCB-MSCs with GBM#1 under fluorescence microscopy (top) and merged picture (bottom). Scale bar indicates 100 μm. The right panel represents number of GBM#1 cells (top graph) cocultured with (black bar) or w/o GFP-labeled UCB-MSCs (white bar) and the number of UCB-MSCs (bottom graph) cocultured with (black bar) or w/o GBM#1 (white bar) (*P<0.05; **P<0.01). (D) GBM#1 was cocultured with adipose-tissue-derived MSCs (AT-MSCs) at a ratio 1:2. The left panel represents coculture of GFP-labeled AT-MSCs with GBM#1 under fluorescence microscopy (top) and merged picture (bottom). Scale bar indicates 100 μm. The right panel represents number of GBM#1 cells (top graph) cocultured with (black bar) or w/o GFP-labeled AT-MSCs (white bar) and the number of UCB-MSCs (bottom graph) cocultured with (black bar) or w/o GBM#1 (white bar) (*P<0.05; **P<0.01). (E) The effect of a conditioned medium of UCB-MSCs (left panel) and AT-MSCs (right panel) was analyzed. GBM#1 cells (2×10⁴ cells) were cultured w/o (white bar) or with 20% condition medium (CM) from each MSC (black bar). Note that CM derived from UCB-MSCs did not affect GBM growth (left panel), whereas CM derived from AT-MSCs promote GBM growth significantly on days 3 and 7 (**P<0.01).
FIG. 3.
FIG. 3.
Analysis of how MSCs affect GBM#1 survival. (A) Expression of growth, angiogenic, and survival factors was analyzed in UCB-MSCs and AT-MSCs by real-time PCR. The expression of factors in UCB-MSCs was normalized to a value of 1 as the standard for each factor. White bar: UCB-MSCs; black bar: AT-MSCs (*P<0.05; **P<0.01). (B) The effect of CXCL12 on GBM#1 was analyzed by FACS. Expression of Annexin V and 7-amino-actinomycin (7-AAD) was determined in the presence or absence of CXCL12. Lower right areas in each (surrounded by bold line) was measured as apoptotic cells according to the manufacturer's instruction. (C) The frequency of 7-AAD/Annexin V+ cells was measured as apoptotic cells by FACS. White bar: GBM#1 alone; hatched-line bar: GBM#1 with recombinant CXCL12; black bar: GBM#1+UCB-MSCs; gray bar: GBM#1+UCB-MSCs with recombinant CXCL12 (**P<0.01). Note that frequency of apoptotic cells after coculture of GBM#1 with UCB-MSCs greatly decreased in the presence of CXCL12. (D) Number of GBM#1 cells after coculture with UCB-MSCs was analyzed with or w/o CXCL12. White bar: GBM#1 alone; hatched-line bar; GBM#1 with recombinant CXCL12; black bar: GBM#1+UCB-MSCs; gray bar: GBM#1+UCB-MSCs with recombinant CXCL12 (**P<0.01). Note that the number of apoptotic cells after coculture of GBM#1 with UCB-MSCs greatly increased in the presence of CXCL12 at the level of GBM#1 alone.
FIG. 4.
FIG. 4.
Analysis of anti-GBM effects of MSCs in vivo. (A) GBM#1 (1×10⁶ cells) and UCB-MSCs or AT-MSCs (2×10⁶ cells) in 100 μL of Matrigel was inoculated subcutaneously into the mouse back skin. After 18 days post-transplantation, tumors were harvested, and tumor weights were measured (right graph). White bar: GBM#1 alone; hatched-line bar: GBM#1+UCB-MSCs; black bar: GBM#1+AT-MSCs (**P<0.01). Scale bar indicates 1 mm. (B) Histological analysis of transplanted tumors was performed staining with H&E (top panel), GFAP (middle panel), and CD31 (bottom panel) antibodies. Sectioned sample from GBM#1 alone (left), GBM+UCB-MSCs (middle), and GBM+AT-MSCs (right) was analyzed for morphology of GBM and angiogenesis. The number of CD31-positive cells was scored (right graph). White bar: GBM#1 alone; hatched-line bar: GBM#1+UCB-MSCs; black bar: GBM#1+AT-MSCs (**P<0.01). Scale bar indicates 200 μm. Note that the number of vessels increased when GBM#1 was transplanted with AT-MSCs. (C) Terminal deoxynucleotidyl transferase-mediated biotinylated UTP nick-end labeling (TUNEL) assay was performed in GBM#1-derived tumors. GBM#1 alone (left), GBM#1+UCB-MSCs (middle), and GBM#1+AT-MSCs (right). The number of TUNEL-positive cells was measured (right graph). White bar: GBM#1 alone; hatched-line bar: GBM#1+UCB-MSCs; black bar: GBM#1+AT-MSCs. Scale bar indicates 200 μm (**P<0.01). Color images available online at www.liebertpub.com/scd
FIG. 5.
FIG. 5.
Analysis of a role of CXCR7 in GBM#1. (A) CXCR7 mRNA expression was analyzed in GBM#1 (white bar) and shCXCR7 GBM#1 (black bar). **P<0.01. (B) Growth activity was analyzed in GBM#1 (white square) and shCXCR7 GBM#1 (black square). Cells were harvested every 24 h until cells reached at a confluent state. (C) GBM#1 (1×10⁶ cells) and shCXCR7 GBM#1 (1×10⁶ cells) with or w/o AT-MSCs (2×10⁶ cells) in 100 mL of Matrigel was inoculated subcutaneously into the mouse back skin. At 18 days post-transplantation, tumors were harvested, and the tumor weight was measured (right graph). White bar: GBM#1 alone; hatched-line bar: GBM#1 shCXCR7; black bar: GBM#1+AT-MSCs; gray bar: GBM#1 shCXCR7+AT-MSCs (**P<0.01). Scale bar indicates 1 mm. (D) TUNEL assay was performed in GBM#1- or shCXCR7 GBM#1-derived tumors with or w/o AT-MSCs. GBM#1 alone (left); shCXCR7 GBM#1 alone (second from the left); GBM#1+AT-MSCs (second from the right); GBM#1 shCXCR7+AT-MSCs (right). The number of TUNEL-positive cells was measured in each tumor (right graph). White bar: GBM#1 alone; hatched-line bar: GBM#1 shCXCR7; black bar: GBM#1+AT-MSCs; gray bar: GBM#1 shCXCR7+AT-MSCs (**P<0.01). Scale bar indicates 200 μm. Note that the highest number of TUNEL-positive cells was observed in tumors derived from shCXCR7+AT-MSCs. Color images available online at www.liebertpub.com/scd
FIG. 6.
FIG. 6.
Analysis of apoptosis derived from UCB-MSCs toward GBM#1. (A) mRNA expression of death ligands was analyzed in UCB-MSCs and AT-MSCs by real-time PCR. The expression of factors in UCB-MSCs was normalized to a value of 1 as the standard for each factor. White bar: UCB-MSCs; black bar: AT-MSCs (*P<0.05; **P<0.01). (B) mRNA expression of death receptors in GBM#1 and U87MG was analyzed by real-time PCR. The expression of factors in GBM#1 was normalized to a value of 1 as the standard for each receptor. White bar: GBM#1; black bar: U87MG (**P<0.01). (C) The effect of tumor necrosis factor-related apoptosis-inducing ligand (TRAIL) and CXCL12 on GBM#1 survival was analyzed. The number of live GBM#1 was measured on days 3 and 7 in the presence of TRAIL (1 ng/mL) with or w/o CXCL12 (10 ng/mL) (left graph). The number of dead GBM#1 was measured in the presence of TRAIL (1 ng/mL) with or w/o CXCL12 (10 ng/mL) (right graph). White bar: GBM#1 alone; black bar; GBM#1+recombinant TRAIL (1 ng/mL); gray bar; GBM#1+recombinant TRAIL+recombinant CXCL12 (10 ng/mL). Note that GBM#1 death induced by TRAIL was inhibited in the presence of CXCL12.

Similar articles

Cited by

References

    1. Pittenger MF. Mackay AM. Beck SC. Jaiswal RK. Douglas R. Mosca JD. Moorman MA. Simonetti DW. Craig S. Marshak DR. Multilineage potential of adult human mesenchymal stem cells. Science. 1999;284:143–147. - PubMed
    1. Kern S. Eichler H. Stoeve J. Kluter H. Bieback K. Comparative analysis of mesenchymal stem cells from bone marrow, umbilical cord blood, or adipose tissue. Stem Cells. 2006;24:1294–1301. - PubMed
    1. Zuk PA. Zhu M. Mizuno H. Huang J. Futrell JW. Katz AJ. Benhaim P. Lorenz HP. Hedrick MH. Multilineage cells from human adipose tissue: implications for cell-based therapies. Tissue Eng. 2001;7:211–228. - PubMed
    1. Asakura A. Komaki M. Rudnicki M. Muscle satellite cells are multipotential stem cells that exhibit myogenic, osteogenic, and adipogenic differentiation. Differentiation. 2001;68:245–253. - PubMed
    1. De Bari C. Dell'Accio F. Tylzanowski P. Luyten FP. Multipotent mesenchymal stem cells from adult human synovial membrane. Arthritis Rheum. 2001;44:1928–1942. - PubMed

Publication types

MeSH terms