. 2012 Dec 21;151(7):1501-1512.
doi: 10.1016/j.cell.2012.11.028. Epub 2012 Dec 6.

Architecture of the Atg17 complex as a scaffold for autophagosome biogenesis

Affiliations

Architecture of the Atg17 complex as a scaffold for autophagosome biogenesis

Michael J Ragusa et al. Cell. .

Abstract

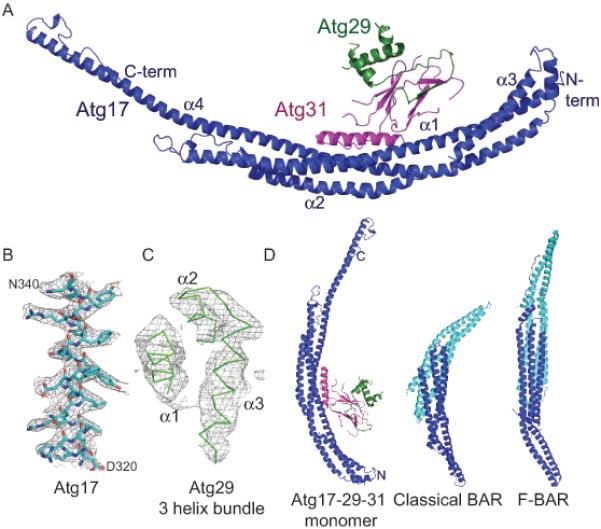
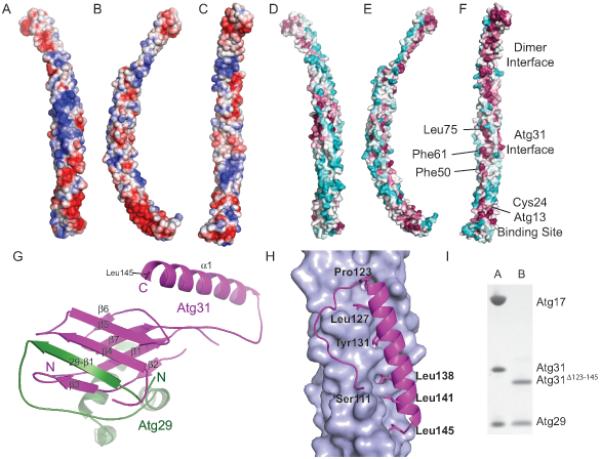
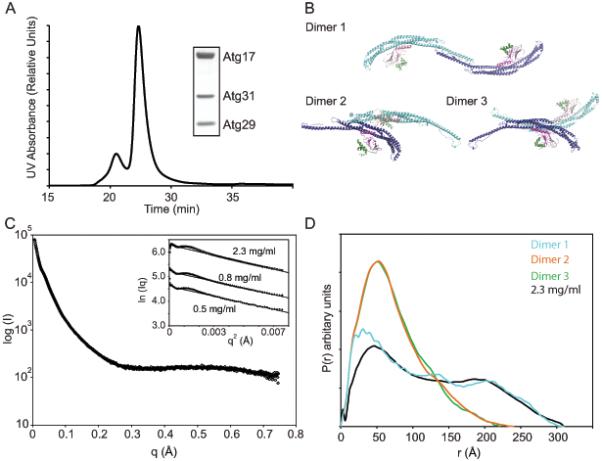
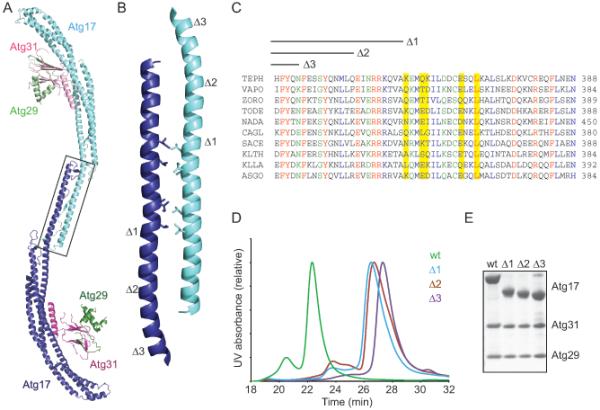
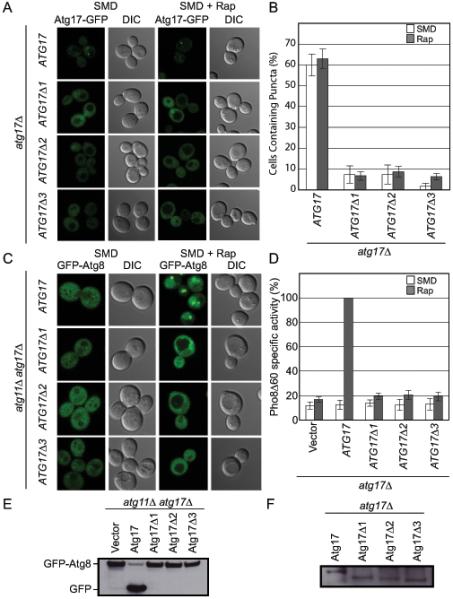
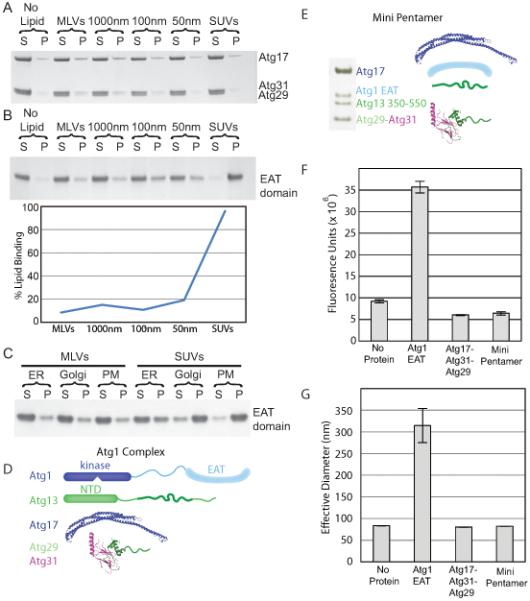
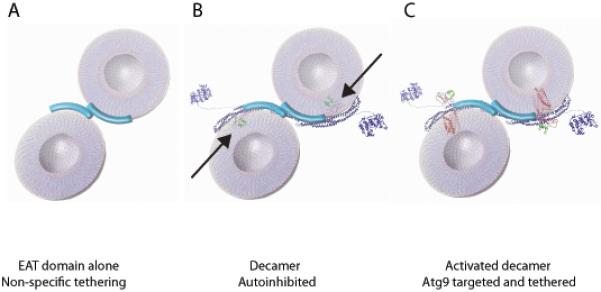
Macroautophagy is a bulk clearance mechanism in which the double-membraned phagophore grows and engulfs cytosolic material. In yeast, the phagophore nucleates from a cluster of 20-30 nm diameter Atg9-containing vesicles located at a multiprotein assembly known as the preautophagosomal structure (PAS). The crystal structure of a 2:2:2 complex of the earliest acting PAS proteins, Atg17, Atg29, and Atg31, was solved at 3.05 Å resolution. Atg17 is crescent shaped with a 10 nm radius of curvature. Dimerization of the Atg17-Atg31-Atg29 complex is critical for both PAS formation and autophagy, and each dimer contains two separate and complete crescents. Upon induction of autophagy, Atg17-Atg31-Atg29 assembles with Atg1 and Atg13, which in turn initiates the formation of the phagophore. The C-terminal EAT domain of Atg1 was shown to sense membrane curvature, dimerize, and tether lipid vesicles. These data suggest a structural mechanism for the organization of Atg9 vesicles into the early phagophore.


Figures

Figure 1
Figure 1
Crystal structure of the Atg17-Atg31-Atg29 complex (A) Ribbon model for the monomer structure of Atg17 (blue), Atg29 (green) and Atg31 (magenta). The N and C termini and 4 α helices of Atg17 are labeled. (B) Representative density from a phase-extended solvent-modified Selenium SAD map calculated at 3.1 Å, contoured at 1.2 σ, overlaid on the refined model of Atg17 residues 320-340. (C) The same map as shown in (B), overlaid on the refined model of the 3 helix bundle of Atg29, illustrating the high mobility of Atg29 relative to the rest of the structure. (D) Ribbon model comparison of Atg17-Atg31-Atg29 with a comparison to the F-BAR domain of FCHo (PDB ID 2V0O) and the BAR domain Arfaptin (PDB ID 1I49). One BAR monomer is colored blue and the other cyan. See also Figures S1-3 and Table S1.
Figure 2
Figure 2
The Atg29-31 subcomplex (A-C) Surface of the Atg17 monomer colored according to electrostatic potential, with saturating blue and red at ± 3 kT/e; (A) Top view (convex side); (B) Side view; (C) Bottom view (concave side). (D-F) Conserved surface residues of the Atg17 monomer, with the surface colored according to the sequence conservation among budding yeasts in a gradient from cyan (highly variable) to magenta (most conserved). (D) Top view (convex side); (E) Side view; (F) Bottom view (concave side). Regions important for dimerization, Atg31 and Atg13 binding are indicated. (G) Detailed view of the interaction between Atg31 (magenta) and Atg29 (green). The seven β strands and one α helix from Atg31 are labeled as well as the N and C-termini. The N-termini and β strand from Atg29 are also labeled. (H) Detailed view of the 4 helix bundle interaction between Atg31 shown in magenta as a cartoon and Atg17 shown in light blue as a surface. (I) SDS-PAGE gel illustrating that the truncation of Atg31 after residue 122 blocks binding of Atg17. Column A: Purified complex of Atg17-Atg31-Atg29. Column B: Purified complex from cells expressing Atg17, Atg29, and Atg31Δ123-145. These complexes include the crystallized Atg29 C-terminal truncation constructs. See also Figure S4.
Figure 3
Figure 3
Structure of the Atg17-Atg31-Atg29 dimer in solution (A) Light scattering experiments were performed on the crystallized construct of Atg17-Atg31-Atg29 containing a C-terminal truncation of Atg29. (B) Three potential Atg17-Atg31-Atg29 dimers resulting from the crystal lattice are shown and are numbered according to their buried surface area content with dimer 1 containing the highest buried surface area. (C) SAXS data were recorded on 2.3 mg ml−1 Atg17-Atg31-Atg29. Rc plots for SAXS data recorded at 0.5, 0.8 and 2.3 mg ml−1 are shown as an inset. The lines represent the fit of the linear region used to determine the Rc. (D) P(r) functions calculated from the experimental scattering data and the three possible dimers structures. See also Tables S2-3.
Figure 4
Figure 4
Deconstruction of the Atg17-Atg31-Atg29 dimer (A) Ribbon model of the Atg17-Atg31-Atg29 dimer. The Atg17 dimer interface is highlighted by a black box. (B) An enlarged view of the Atg17 dimerization interface as is highlighted in A. Hydrophobic residues forming the bulk of the interaction are shown as stick representations. (C) Sequence alignment for the region of the Atg17 dimer shown in B. The hydrophobic residues which form the bulk of the interface are highlighted in yellow. The end of each truncated Atg17 sequence (Δ1, Δ2, and Δ3) used to confirm the dimer are highlighted above the alignment. Residues are colored as follows: red, completely conserved, blue, well conserved strongly similar residues, green, well conserved weakly similar residues. Abbreviations used: TEPH: Tetrapisispora phaffii, VAPO: Vanderwaltozyma polyspora, ZORO: Zygosaccharomyces rouxii, TODE: Torulaspora delbrueckii, NADA: Naumovozyma dairenensis, CAGL: Candida glabrata, SACE: Saccharomyces cerevisiae, KLTH: Kluyveromyces thermotolerans, KLLA: Kluyveromyces lactis, AsGO: Ashbya gossypii. (D) Size exclusion chromatography for Atg17-Atg31-Atg29 and the Δ1, Δ2, and Δ3 dimerization site truncations using a WTC-030S5. This column was in line with a Wyatt Dawn Heleos II instrument and the molecular weight of each peak was confirmed by light scattering. (E) SDS-PAGE of the purified Atg17-Atg31-Atg29, and the Δ1, Δ2, and Δ3 C-terminal truncations of Atg17. These complexes all include the crystallized Atg29 C-terminal truncation constructs.
Figure 5
Figure 5
Atg17 dimerization is essential for PAS formation and autophagy (A) Representative microscopy of ATG17-GFP, ATG17Δ1-GFP, ATG17Δ2-GFP, and ATG17Δ3-GFP in the absence (left) and presence (right) of rapamycin treatment. (B) Quantification of the microscopy from part (A). A total of 3 trials with 100 cells counted per trial. (C) Representative microscopy images of atg11Δ atg17Δ GFP-ATG8 cells transformed with ATG17, ATG17Δ1, ATG17Δ2, and ATG17Δ3 in the absence (left) and presence (right) of rapamycin treatment are shown. (D) Pho8Δ60 assay to monitor autophagy was performed in the absence (white) and presence (grey) of rapamycin treatment. Samples were normalized to the activity of Atg17 in rapamycin treated cells. (E) GFP-Atg8 processing assay as monitored by western blot against GFP. The GFP-Atg8 and GFP bands are labeled. (F) Western blot against GFP to monitor the expression of Atg17-GFP. Error bars in (B) and (D) represent the standard deviation of triplicate experiments. See also Table S4.
Figure 6
Figure 6
Regulated high curvature vesicle tethering by the EAT domain (A) Liposome sedimentation assays for the full-length Atg17-Atg31-Atg29 complex with Folch liposomes of varying diameters. Atg17-Atg31-Atg29 does not bind to Folch liposomes of any size. (B) Liposome sedimentation assay for the EAT domain with Folch liposomes of varying diameters. Atg1 shows a strong preference for small sonicated Folch liposomes. (C) Liposome sedimentation assay for the EAT domain with liposomes mimicking the endoplasmic reticulum (ER), golgi apparatus and plasma membrane (PM) of S. cerevisiae. (D) SDS-PAGE of the minimal Atg1 complex. The bands for Atg1, 13, 17, 29 and 31 are labeled. Atg29 and Atg31 run at identical locations on SDS-PAGE. (E) Schematic of the full-length Atg1 complex, for comparison to the mini-pentamer expressed in (D). (F) Sonicated liposomes containing biotin were mixed with fluorescently labeled sonicated liposomes and buffer, the EAT domain, full-length Atg17-Atg31-Atg29 or the mini-pentamer. The EAT domain potently tethers vesicles, but Atg17-Atg31-Atg29 does not. Atg17-Atg31-Atg29 inhibits tethering by the EAT domain. Biotin liposomes were captured by streptavidin resin and the amount of fluorescent lipid tethered to the biotin liposomes was quantified. (G) The effective diameter of SUVs obtained from light scattering with no protein, the EAT domain, full-length Atg17-Atg31-Atg29 or the mini-pentamer. The increase in the effective liposome diameter induced by the EAT domain shows that it tethers liposomes. The lack of increase above baseline shows that the other complexes tested do not tether liposomes, consistent with results in (F). Error bars in (F) and (G) represent the standard deviation of triplicate experiments.
Figure 7
Figure 7
Model for vesicle tethering at the PAS by the Atg1 complex. (A) Two 20 nm vesicles are shown being coordinated by the EAT domain dimer. (B) The mini-pentamer is unable to bind lipid vesicles in this model due to steric hinderance of Atg29-Atg31 highlighted by arrows. Atg17-Atg31-Atg29 is shown as a ribbon structural model. The kinase domain of Atg1 (KD) represented by the coordinates of a homologous protein kinase catalytic domain of known structure (PDB 4DC2). Unstructured regions of Atg1 are represented as lines. Atg13 bridges Atg1 and Atg17, but is omitted from the graphic for simplicity. (C) In this hypothetical model, the minipentamer is predicted to be able to coordinate two vesicles containing Atg9 following a change in position of the Atg29-Atg31 subcomplex to unblock the Atg17 crescent. The structure of rhodopsin (PDB 1U19) is used as a stand-in for the structure of Atg9 in order to represent the likely dimensions of the transmembrane domain of Atg9, although Atg9 has no sequence homology to rhodopsin.

Comment in

Similar articles

Cited by

References

    1. Chan EY, Longatti A, McKnight NC, Tooze SA. Kinase-inactivated ULK proteins inhibit autophagy via their conserved C-terminal domains using an Atg13-independent mechanism. MolCell Biol. 2009;29:157–171. - PMC - PubMed
    1. Cheong H, Nair U, Geng JF, Klionsky DJ. The Atg1 kinase complex is involved in the regulation of protein recruitment to initiate sequestering vesicle formation for nonspecific autophagy in Saccharomyces cerevisiae. Molecular Biology of the Cell. 2008;19:668–681. - PMC - PubMed
    1. Choi JD, Ryu M, Ae Park M, Jeong G, Lee JS. FIP200 inhibits beta-catenin-mediated transcription by promoting APC-independent beta-catenin ubiquitination. Oncogene. 2012 epub ahead of print. - PubMed
    1. Cowtan K, Main P. Miscellaneous algorithms for density modification. Acta Crystallogr Sect D-Biol Crystallogr. 1998;54:487–493. - PubMed
    1. Emsley P, Lohkamp B, Scott WG, Cowtan K. Features and development of Coot. Acta Crystallogr Sect D-Biol Crystallogr. 2010;66:486–501. - PMC - PubMed

Publication types

MeSH terms

Associated data