

The duplicated genes database: identification and functional annotation of co-localised duplicated genes across genomes
- PMID: 23209799
- PMCID: PMC3508997
- DOI: 10.1371/journal.pone.0050653
The duplicated genes database: identification and functional annotation of co-localised duplicated genes across genomes
Abstract
Background: There has been a surge in studies linking genome structure and gene expression, with special focus on duplicated genes. Although initially duplicated from the same sequence, duplicated genes can diverge strongly over evolution and take on different functions or regulated expression. However, information on the function and expression of duplicated genes remains sparse. Identifying groups of duplicated genes in different genomes and characterizing their expression and function would therefore be of great interest to the research community. The 'Duplicated Genes Database' (DGD) was developed for this purpose.
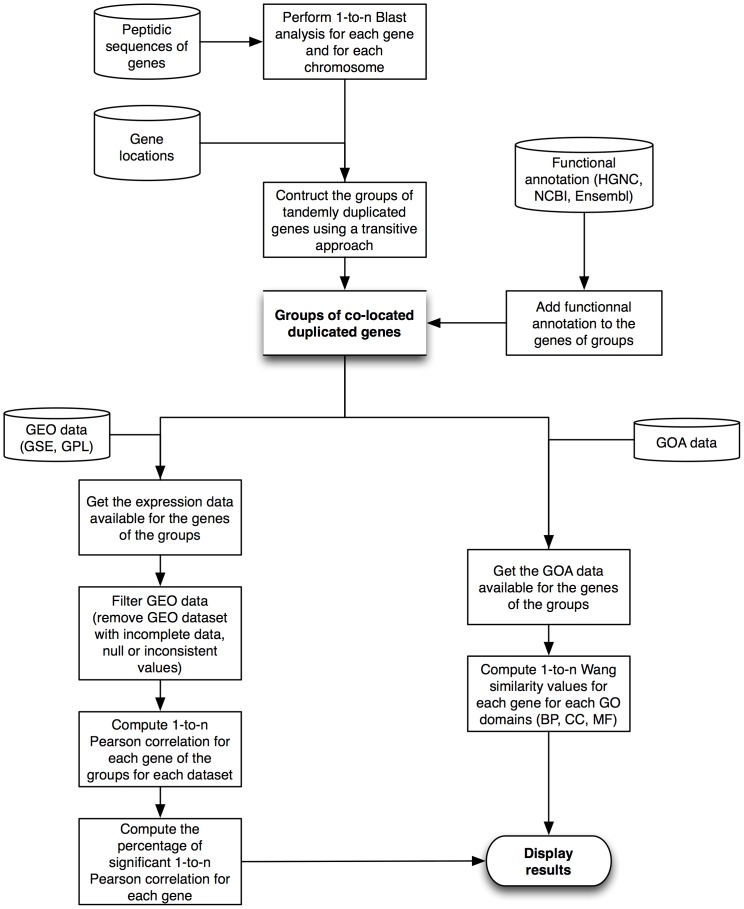
Methodology: Nine species were included in the DGD. For each species, BLAST analyses were conducted on peptide sequences corresponding to the genes mapped on a same chromosome. Groups of duplicated genes were defined based on these pairwise BLAST comparisons and the genomic location of the genes. For each group, Pearson correlations between gene expression data and semantic similarities between functional GO annotations were also computed when the relevant information was available.
Conclusions: The Duplicated Gene Database provides a list of co-localised and duplicated genes for several species with the available gene co-expression level and semantic similarity value of functional annotation. Adding these data to the groups of duplicated genes provides biological information that can prove useful to gene expression analyses. The Duplicated Gene Database can be freely accessed through the DGD website at http://dgd.genouest.org.
Conflict of interest statement
Figures
Similar articles
-
An Experimental Approach to Genome Annotation: This report is based on a colloquium sponsored by the American Academy of Microbiology held July 19-20, 2004, in Washington, DC.Washington (DC): American Society for Microbiology; 2004. Washington (DC): American Society for Microbiology; 2004. PMID: 33001599 Free Books & Documents. Review.
-
A phylogenomic gene cluster resource: the Phylogenetically Inferred Groups (PhIGs) database.BMC Bioinformatics. 2006 Apr 11;7:201. doi: 10.1186/1471-2105-7-201. BMC Bioinformatics. 2006. PMID: 16608522 Free PMC article.
-
Recent segmental and gene duplications in the mouse genome.Genome Biol. 2003;4(8):R47. doi: 10.1186/gb-2003-4-8-r47. Epub 2003 Jul 9. Genome Biol. 2003. PMID: 12914656 Free PMC article.
-
A scale of functional divergence for yeast duplicated genes revealed from analysis of the protein-protein interaction network.Genome Biol. 2004;5(10):R76. doi: 10.1186/gb-2004-5-10-r76. Epub 2004 Sep 15. Genome Biol. 2004. PMID: 15461795 Free PMC article.
-
Evolution of the duplicated intracellular lipid-binding protein genes of teleost fishes.Mol Genet Genomics. 2017 Aug;292(4):699-727. doi: 10.1007/s00438-017-1313-5. Epub 2017 Apr 7. Mol Genet Genomics. 2017. PMID: 28389698 Review.
Cited by
-
Multi-modal meta-analysis of cancer cell line omics profiles identifies ECHDC1 as a novel breast tumor suppressor.Mol Syst Biol. 2021 Mar;17(3):e9526. doi: 10.15252/msb.20209526. Mol Syst Biol. 2021. PMID: 33750001 Free PMC article.
-
Extensive disruption of protein interactions by genetic variants across the allele frequency spectrum in human populations.Nat Commun. 2019 Sep 12;10(1):4141. doi: 10.1038/s41467-019-11959-3. Nat Commun. 2019. PMID: 31515488 Free PMC article.
-
eDGAR: a database of Disease-Gene Associations with annotated Relationships among genes.BMC Genomics. 2017 Aug 11;18(Suppl 5):554. doi: 10.1186/s12864-017-3911-3. BMC Genomics. 2017. PMID: 28812536 Free PMC article.
-
The impact of the protein interactome on the syntenic structure of mammalian genomes.PLoS One. 2017 Sep 14;12(9):e0179112. doi: 10.1371/journal.pone.0179112. eCollection 2017. PLoS One. 2017. PMID: 28910296 Free PMC article.
-
Systematic analysis of bypass suppression of essential genes.Mol Syst Biol. 2020 Sep;16(9):e9828. doi: 10.15252/msb.20209828. Mol Syst Biol. 2020. PMID: 32939983 Free PMC article.
References
-
- Barrans JD, Ip J, Lam C-W, Hwang IL, Dzau VJ, et al. (2003) Chromosomal distribution of the human cardiovascular transcriptome. Genomics 81: 519–524. - PubMed
-
- Ko MS, Threat TA, Wang X, Horton JH, Cui Y, et al. (1998) Genome-wide mapping of unselected transcripts from extraembryonic tissue of 7.5-day mouse embryos reveals enrichment in the t-complex and under-representation on the X chromosome. Hum Mol Genet 7: 1967–1978. - PubMed
-
- Minagawa S, Nakabayashi K, Fujii M, Scherer SW, Ayusawa D (2004) Functional and chromosomal clustering of genes responsive to 5-bromodeoxyuridine in human cells. Experimental Gerontology 39: 1069–1078. - PubMed
-
- Purmann A, Toedling J, Schueler M, Carninci P, Lehrach H, et al. (2007) Genomic organization of transcriptomes in mammals: Coregulation and cofunctionality. Genomics 89: 580–587. - PubMed
Publication types
MeSH terms
Grants and funding
LinkOut - more resources
Full Text Sources
Other Literature Sources
Molecular Biology Databases
Research Materials
