. 2012;8(11):e1003046.
doi: 10.1371/journal.ppat.1003046. Epub 2012 Nov 29.

Intracellular vesicle acidification promotes maturation of infectious poliovirus particles

Affiliations

Intracellular vesicle acidification promotes maturation of infectious poliovirus particles

Alexsia L Richards et al. PLoS Pathog. 2012.

Abstract

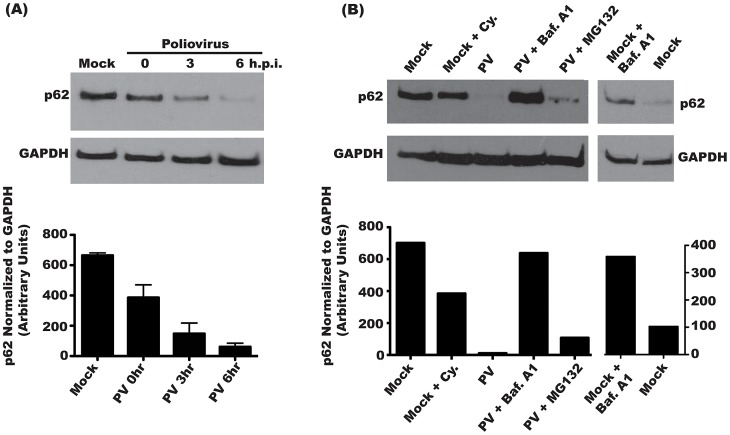
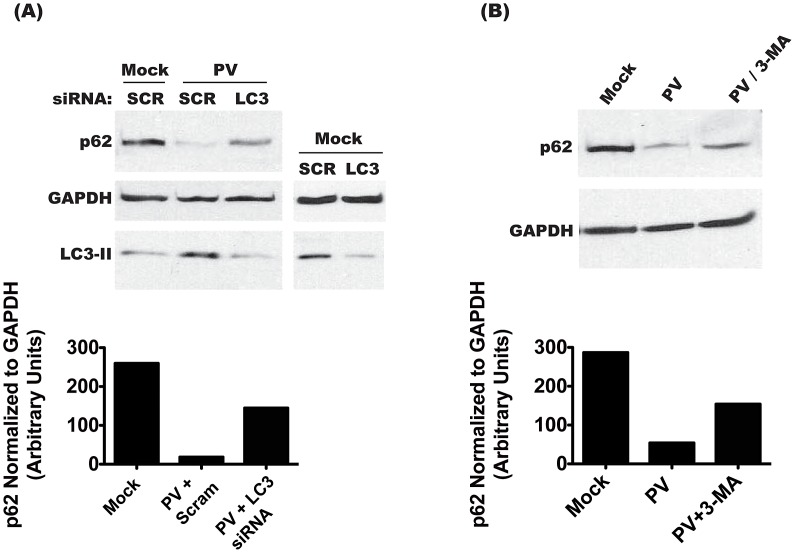
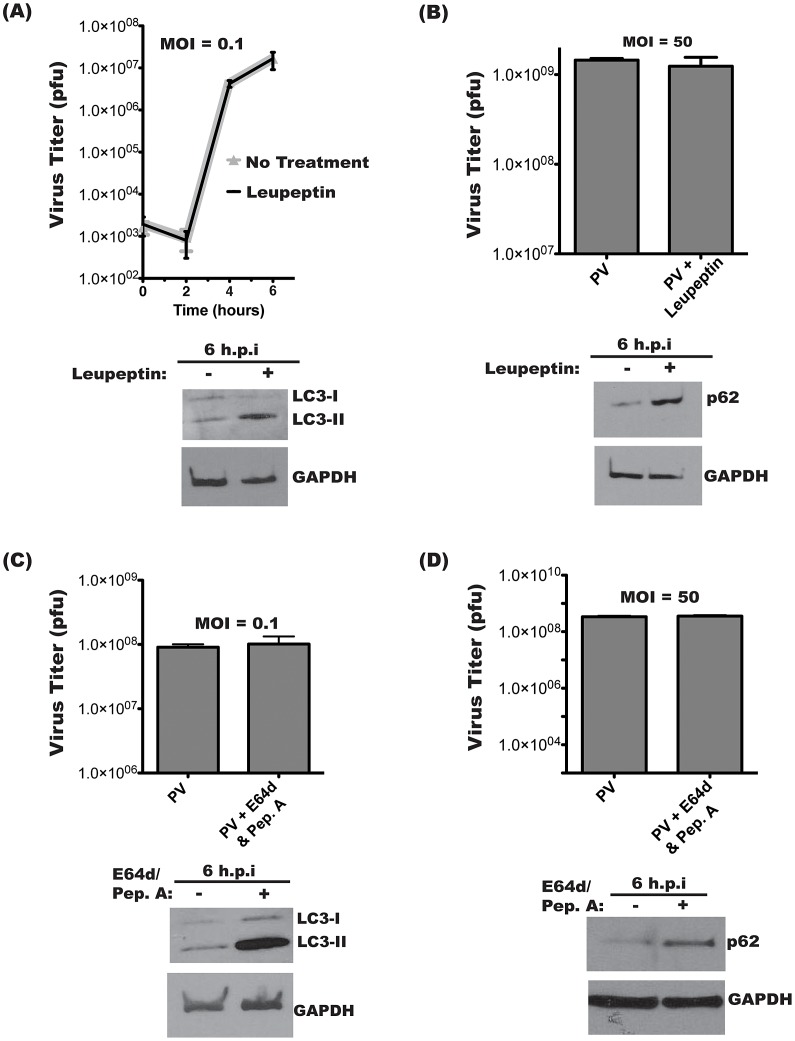
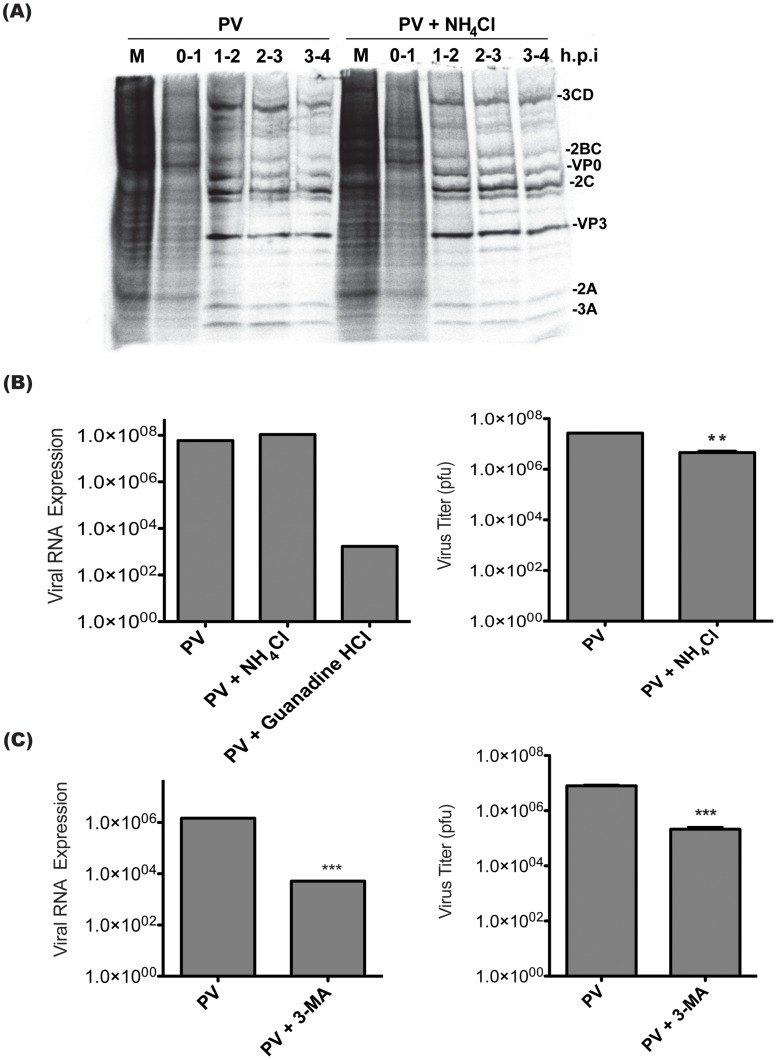
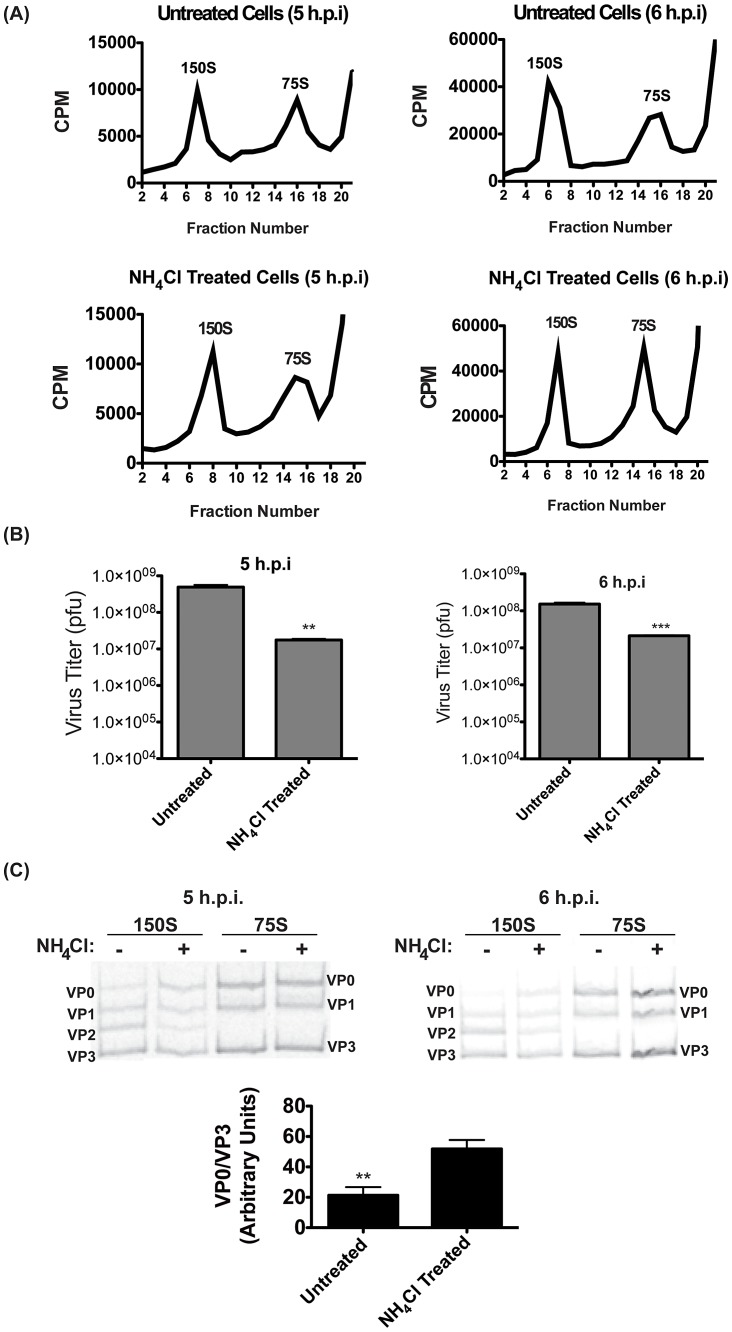
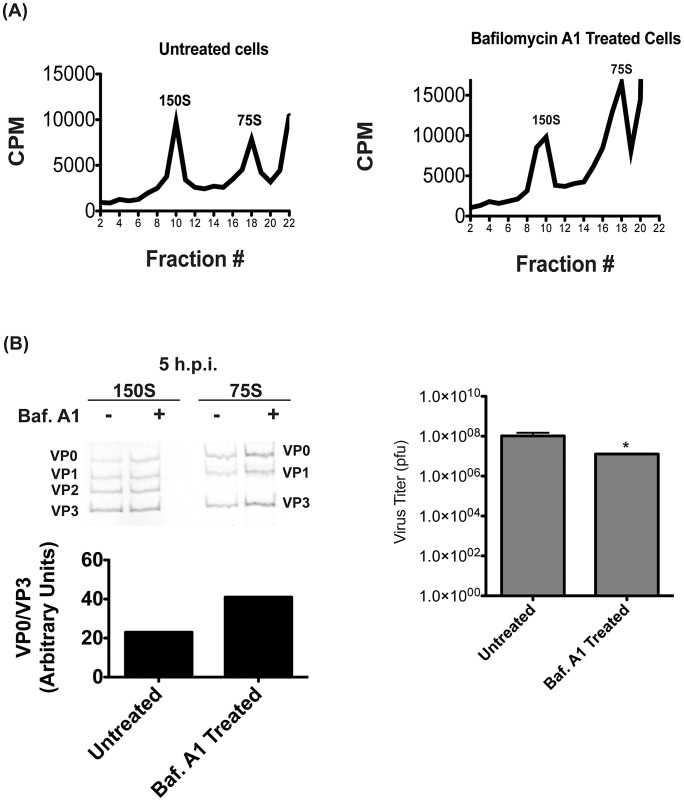
The autophagic pathway acts as part of the immune response against a variety of pathogens. However, several pathogens subvert autophagic signaling to promote their own replication. In many cases it has been demonstrated that these pathogens inhibit or delay the degradative aspect of autophagy. Here, using poliovirus as a model virus, we report for the first time bona fide autophagic degradation occurring during infection with a virus whose replication is promoted by autophagy. We found that this degradation is not required to promote poliovirus replication. However, vesicular acidification, which in the case of autophagy precedes delivery of cargo to lysosomes, is required for normal levels of virus production. We show that blocking autophagosome formation inhibits viral RNA synthesis and subsequent steps in the virus cycle, while inhibiting vesicle acidification only inhibits the final maturation cleavage of virus particles. We suggest that particle assembly, genome encapsidation, and virion maturation may occur in a cellular compartment, and we propose the acidic mature autophagosome as a candidate vesicle. We discuss the implications of our findings in understanding the late stages of poliovirus replication, including the formation and maturation of virions and egress of infectious virus from cells.


Conflict of interest statement

The authors have declared that no competing interests exist.

Figures

Figure 1
Figure 1. Steady state levels of p62 decrease during poliovirus infection.
(A) H1-Hela cells were mock infected or infected with poliovirus (MOI = 50 pfu/cell) and cells were lysed at the indicated hours post-infection (h.p.i.). Three independent experiments were measured for quantification of p62 levels, and the blot shown is representative. (B) H1-Hela cells were mock infected or infected with poliovirus (MOI = 50 pfu/cell) and cells were lysed at 6 h.p.i. Cycloheximide (Cy.) was added to mock infected cells at a final concentration of 50 µg/mL, for 4 hours. Cells were then pre-treated with 0.1 µM bafilomycin A1 (Baf.A1) for 14 hours prior to infection and kept under treatment throughout infection. MG132 was used at a final concentration of 20 µM and added to the media at the time of infection. The blot shown is representative of three independent experiments.
Figure 2
Figure 2. Degradation of p62 is dependent on the induction of autophagy.
(A) Cells were transfected with scrambled (SCR) or anti-LC3 (LC3) siRNAs, and 48 h later infected with PV at an MOI of 50 pfu/cell, or mock infected. Cells were collected at 6 h.p.i., and immunoblots were performed on lysates for p62, GAPDH, and LC3. (B) Cells were treated with 10 mM 3-MA for 12 h, then infected with PV at an MOI of 50 pfu/cell, or mock infected. Cells were collected at 6 h.p.i. and lysates were used for immunoblots.
Figure 3
Figure 3. Intracellular poliovirus yields are not affected by lysosomal protease inhibitors.
Triplicate samples of H1-Hela cells were infected with PV at an MOI of 0.1 pfu/cell (A) or MOI of 50 pfu/cell (B). Cells were pre-treated with 20 µM leupeptin for 14 hours prior to infection and kept under treatment throughout infection. Cell-associated virus was collected at the indicated times post-infection, and virus titers were determined by plaque assay. Parallel infections were collected for Western blots of LC3 (A) or p62 (B) In (B) cell-associated virus was collected at 6 h.p.i. for plaque assay. (C) Infections were performed as in (A), then 10 µg/mL each of E64d and Pepstatin A (Pep.A) were added to the media at the time of infection. Inhibition of lysosomal degradation was confirmed by immunoblot for LC3 and GAPDH. (D) Infection at an MOI of 50 pfu/cell, with E64/Pep.A as in (C).
Figure 4
Figure 4. Intracellular poliovirus yields are reduced when cells are treated with inhibitors of vesicle acidification.
(A) Triplicate samples of H1-Hela cells were infected with PV at an MOI of 0.1 pfu/cell, and cell-associated virus was collected at the indicated times post-infection. NH4Cl (20 mM) was added to the media at the time of infection (solid line). Virus titers were then determined by plaque assay. (B) Infection as in (A), carried out to 16 h to represent a multiple-cycle infection. (C) Triplicate H1-Hela infections with PV at an MOI of 50 pfu/cell, with cell-associated virus collected at 6 h.p.i. (D) Cells were infected as in (A), then NH4Cl was added to half of the samples at 3.5 hours post-infection, and cell-associated virus was collected immediately or at 7 h.p.i. (E) Cells were pre-treated for 14 hours with 0.1 µM bafilomycin A1 (Baf.A1) and kept under treatment throughout infection (MOI = 0.1 pfu/cell). Cell-associated virus was collected at 6 or 12 h.p.i. and virus titers were determined by plaque assay. * p<0.05, ** p<0.01, *** p<0.0001.
Figure 5
Figure 5. Poliovirus entry, translation, and RNA replication are unaffected by treatment with inhibitors of vesicle acidification.
(A) H1-HeLa cells were infected with PV at an MOI of 50 pfu/cell. Cells were pulsed at the indicated h.p.i with 35S-labeled methionine for 1 h then lysed. Lysates were run on SDS-PAGE. Expected viral proteins are labeled according to recognized banding patterns. (B) Triplicate plates of H1-Hela cells were infected with PV at an MOI of 0.1 pfu/cell, virus RNA and host GAPDH RNA were measured by qRT-PCR. Virus RNA levels were normalized to GAPDH levels using the delta-Ct method. NH4Cl treatment was as described in Figure 4, and Guanidine HCl (2 mM) was added to the media at the time of infection. The data shown are pooled from three replicate experiments, and the titer of cell-associated virus collected at 6h.p.i. from each replicate was determined by plaque assay. (C) Triplicate plates of 293T cells were treated with 20 mM 3-MA for 2 hours prior to infection, and kept under treatment throughout infection. PV infections were done at an MOI of 0.1 pfu/cell. RNA levels and virus titers were analyzed as in (B). ** p<0.01, *** p<0.0001.
Figure 6
Figure 6. Virion maturation requires acidic compartments.
(A) H1-Hela cells were infected at an MOI of 50 pfu/cell, and half of the samples were treated with NH4Cl. Cells were labeled with 35S-Methionine from 3 h.p.i. until collection at 5 or 6 h.p.i., and lysates were then separated on a 15–30% sucrose gradients. Fractions were then collected and the counts per minute (CPM) were analyzed for each fraction. Representative gradients from three independent experiments are shown. (B) The three fractions representing the 150S peak in each experiment were pooled for plaque assay analysis. Data shown are the averages from three independent experiments. (C) Three fractions representing the 150S and 75S peaks were pooled and run on SDS-PAGE, and the 35S-Methionine labeled bands were visualized. The bands are labeled according to expected relative migration pattern, and VP2 is identified by its absence in the 75S peak. The ratio of VP0 to VP3 bands was analyzed from four independent experiments and plotted in arbitrary units. * p<0.05, ** p<0.01, *** p<0.0001.
Figure 7
Figure 7. Proton pump inhibition also affects virion maturation.
(A) H1-Hela cells were infected at an MOI of 50 pfu/cell, and half of the samples were treated with bafilomycin A1 as described in Figure 4. Cells were labeled with 35S-Methionine from 3 h.p.i. until collection at 5 h.p.i., and lysates were then separated on a 15–30% sucrose gradients. Fractions were then collected and the counts per minute (CPM) were analyzed for each fraction. (B) Three fractions representing the 150S and 75S peaks were pooled and run on SDS-PAGE as in Figure 6. The ratio of VP0 to VP3 bands was analyzed and plotted in arbitrary units. The titer of the infectious virus in the pooled 150S fractions was determined by plaque assay. * p<0.05.
Figure 8
Figure 8. Model of potential roles of autophagosome-amphisome in PV production and cell exit.
We have demonstrated that initiation of autophagy is required for viral RNA replication, while vesicle acidification is required for maturation of virus particles. In our model, by 2–3 h post-infection processed 3A protein integrates into single-membraned structures resembling secretory vesicles, which become the initial sites of viral RNA replication. 3-MA either inhibits formation of these single-membraned vesicles which act as the site of RNA replication, or inhibits the progress of these vesicles into double-membraned vesicles, which act as replication sites. As the peak of viral genome replication (3 h) passes, the autophagic machinery is engaged to change the single-membraned vesicles into double-membraned vesicles. As a result, some of RNA replication complexes and capsid proteins are trapped within the double-membraned vesicles, while some are cytosolic. As the amphisomes acidify, particle maturation is more efficient inside the vesicles. Maturation of the amphisomes can be inhibited using NH4Cl or bafilomycin A1. The mature virions, surrounded by two membranes, have a topological problem in exiting the cell. We propose three possible mechanisms for exit. The outer membrane fuses with the plasma membrane, releasing a short-lived labile single-membraned vesicle containing virus, which eventually is released into the extracellular milieu. The double-membraned vesicles lose one membrane, as occurs during maturation of cellular autophagosomes, and the single-membraned vesicles fuse with the plasma membrane. Virus exits the vesicle into the cytoplasm due to breakup of the vesicle or another mechanism. Virus then exits the cell when lysis occurs at approximately 8 h post-infection.

Similar articles

Cited by

References

    1. Whitton JL, Cornell CT, Feuer R (2005) Host and virus determinants of picornavirus pathogenesis and tropism. Nat Rev Microbiol 3 10 765–776. - PubMed
    1. Dales S, Eggers HJ, Tamm I, Palade GE (1965) Electron microscopic study of the formation of poliovirus. Virology 26: 379–389. - PubMed
    1. Schlegel A, Giddings TH Jr, Ladinsky MS, Kirkegaard K (1996) Cellular origin and ultrastructure of membranes induced during poliovirus infection. J Virol 70 10 6576–6588. - PMC - PubMed
    1. Tanida I (2011) Autophagy basics. Microbiol Immunol 55 1 1–11. - PubMed
    1. Mizushima N (2007) Autophagy: Process and function. Genes Dev 21 22 2861–2873. - PubMed

Publication types

Grants and funding

The authors thank the Advancing a Healthier Wisconsin program for support. The funders had no role in study design, data collection and analysis, decision to publish, or preparation of the manuscript.