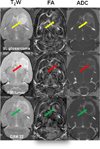
Diffusion tensor magnetic resonance imaging of rat glioma models: a correlation study of MR imaging and histology
- PMID: 23192213
- PMCID: PMC3513798
- DOI: 10.1097/RCT.0b013e3182685436
Diffusion tensor magnetic resonance imaging of rat glioma models: a correlation study of MR imaging and histology
Abstract
Introduction: Diffusion tensor magnetic resonance (MR) imaging (DTI) can be used to characterize the microstructures of ordered biological tissues. This study was designed to assess histological features of gliomas and surrounding brain tissues in rats using DTI.
Methods: Three types of tumors, a 9L gliosarcoma (n = 8), a F98 glioma (n = 5), and a human glioblastoma xenograft (GBM22; n = 8) were incubated in rat brains and underwent conventional MRI and DTI scanning using a 4.7-T animal MRI system. Fractional anisotropy (FA), isotropic apparent diffusion coefficient, parallel diffusivity (λ//), and perpendicular diffusivity (λ⊥), as well as histological features within several regions of interest were analyzed.
Results: All tumor masses consisted of low-FA central zones (tumor center) and high-FA peripheral regions (tumor rim). Histological examination revealed the existence of highly coherent tumor organizations (circular for 9L and F98 or radial for GBM22) in the tumor rims. There were higher apparent diffusion coefficient, λ⊥, and λ// in the peritumoral edema compared to the contralateral gray matter. There were significantly lower FA and higher λ⊥ in the ipsilateral white matter than in the contralateral white matter for the GBM22 tumor, whereas there were no differences for the 9L and F98 tumors. Histologic examination showed GBM22 tumor infiltration into the ipsilateral damaged white matter.
Conclusions: Quantitative analysis of DTI indices provides useful information for assessing tumor microstructure and tumor cell invasion into the adjacent gray matter and white matter.
Conflict of interest statement
No Conflict of Interest to declare.
Figures


Similar articles
-
Unique patterns of diffusion directionality in rat brain tumors revealed by high-resolution diffusion tensor MRI.Magn Reson Med. 2007 Sep;58(3):454-62. doi: 10.1002/mrm.21371. Magn Reson Med. 2007. PMID: 17763344 Free PMC article.
-
Diffusion tensor MRI in rat models of invasive and well-demarcated brain tumors.NMR Biomed. 2008 Mar;21(3):208-16. doi: 10.1002/nbm.1183. NMR Biomed. 2008. PMID: 17530617
-
Evaluation of radiation necrosis and malignant glioma in rat models using diffusion tensor MR imaging.J Neurooncol. 2012 Mar;107(1):51-60. doi: 10.1007/s11060-011-0719-x. Epub 2011 Sep 27. J Neurooncol. 2012. PMID: 21948114 Free PMC article.
-
The role of diffusion tensor imaging in the evaluation of ischemic brain injury - a review.NMR Biomed. 2002 Nov-Dec;15(7-8):561-9. doi: 10.1002/nbm.786. NMR Biomed. 2002. PMID: 12489102 Review.
-
Diffusion-weighted MR of the brain: methodology and clinical application.Radiol Med. 2005 Mar;109(3):155-97. Radiol Med. 2005. PMID: 15775887 Review. English, Italian.
Cited by
-
White Matter Tracts and Diffuse Lower-Grade Gliomas: The Pivotal Role of Myelin Plasticity in the Tumor Pathogenesis, Infiltration Patterns, Functional Consequences and Therapeutic Management.Front Oncol. 2022 Mar 2;12:855587. doi: 10.3389/fonc.2022.855587. eCollection 2022. Front Oncol. 2022. PMID: 35311104 Free PMC article. Review.
-
Preoperative Quantitative MR Tractography Compared with Visual Tract Evaluation in Patients with Neuropathologically Confirmed Gliomas Grades II and III: A Prospective Cohort Study.Radiol Res Pract. 2016;2016:7671854. doi: 10.1155/2016/7671854. Epub 2016 Apr 17. Radiol Res Pract. 2016. PMID: 27190647 Free PMC article.
-
Translation of the ecological trap concept to glioma therapy: the cancer cell trap concept.Future Oncol. 2013 Jun;9(6):817-24. doi: 10.2217/fon.13.30. Future Oncol. 2013. PMID: 23718302 Free PMC article.
-
Radiation induced brain injury: assessment of white matter tracts in a pre-clinical animal model using diffusion tensor MR imaging.J Neurooncol. 2013 Mar;112(1):9-15. doi: 10.1007/s11060-012-1031-0. Epub 2013 Jan 20. J Neurooncol. 2013. PMID: 23334608
-
Diffusion Kurtosis Imaging of Gliomas Grades II and III - A Study of Perilesional Tumor Infiltration, Tumor Grades and Subtypes at Clinical Presentation.Radiol Oncol. 2017 Feb 15;51(2):121-129. doi: 10.1515/raon-2017-0010. eCollection 2017 Jun. Radiol Oncol. 2017. PMID: 28740446 Free PMC article.
References
-
- Wen PY, Kesari S. Malignant gliomas in adults. N Engl J Med. 2008 Jul 31;359(5):492–507. - PubMed
-
- Soo TM, Bernstein M, Provias J, et al. Failed stereotactic biopsy in a series of 518 cases. Stereotact Funct Neurosurg. 1995;64(4):183–196. - PubMed
-
- Murphy M, Loosemore A, Ferrer I, et al. Neuropathological diagnostic accuracy. Br J Neurosurg. 2002 Oct;16(5):461–464. - PubMed
-
- Bernstein M, Parrent AG. Complications of CT-guided stereotactic biopsy of intra-axial brain lesions. J Neurosurg. 1994 Aug;81(2):165–168. - PubMed
Publication types
MeSH terms
Grants and funding
LinkOut - more resources
Full Text Sources
Medical

