. 2012:3:1227.
doi: 10.1038/ncomms2230.

Fibrinogen-induced perivascular microglial clustering is required for the development of axonal damage in neuroinflammation

Affiliations
Free PMC article

Fibrinogen-induced perivascular microglial clustering is required for the development of axonal damage in neuroinflammation

Dimitrios Davalos et al. Nat Commun. 2012.
Free PMC article

Abstract

Blood-brain barrier disruption, microglial activation and neurodegeneration are hallmarks of multiple sclerosis. However, the initial triggers that activate innate immune responses and their role in axonal damage remain unknown. Here we show that the blood protein fibrinogen induces rapid microglial responses toward the vasculature and is required for axonal damage in neuroinflammation. Using in vivo two-photon microscopy, we demonstrate that microglia form perivascular clusters before myelin loss or paralysis onset and that, of the plasma proteins, fibrinogen specifically induces rapid and sustained microglial responses in vivo. Fibrinogen leakage correlates with areas of axonal damage and induces reactive oxygen species release in microglia. Blocking fibrin formation with anticoagulant treatment or genetically eliminating the fibrinogen binding motif recognized by the microglial integrin receptor CD11b/CD18 inhibits perivascular microglial clustering and axonal damage. Thus, early and progressive perivascular microglial clustering triggered by fibrinogen leakage upon blood-brain barrier disruption contributes to axonal damage in neuroinflammatory disease.


Conflict of interest statement

H. Lundbeck A/S is sponsoring research in Dr Akassoglou's laboratory to identify therapeutic candidates for neurological diseases. Dr Akassoglou is also a consultant for H. Lundbeck A/S.

Figures
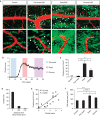
Figure 1
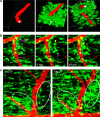
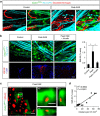
Figure 1. In vivo imaging of perivascular microglial cluster formation at different stages of EAE.
(a) Representative maximum projections of z-stacks of images show microglia and pial macrophages (green) and the vasculature (red) in healthy (control), pre-symptomatic EAE (pre-onset EAE, clinical score 0), at the peak of clinical signs (peak EAE, mean clinical score 2.9), and at chronic EAE (mean clinical score 2.2). Arrowheads show areas of increased cell density appearing only in proximity to the vasculature. Images shown are from mice on days 8 (pre-onset), 17 (peak) and 31 (chronic) after induction of EAE. At least 10–15 mice were imaged per group. Scale bars, top: 100 μm; bottom: 20 μm. See corresponding Supplementary Movie 1. (b) EAE clinical score graph from a single representative experiment showing the timepoints selected for imaging during pre-onset, peak and chronic EAE. Values are mean±s.e.m., n=10 mice. (c) Clusters were undetectable (UN) in healthy controls (n=5), but were detected in pre-onset EAE mice (n=5) and increased in number at peak (n=7) and chronic (n=5) EAE. Values are mean±s.e.m. *P<0.05, **P<0.01, ***P<0.001 (one-way analysis of variance (ANOVA)). (d) 98% of clusters appeared in contact or within 30 μm from a blood vessel (data from 50 clusters in 12 mice). (e) Correlation analysis of the number of clusters with clinical score in EAE, at stages ranging from pre-onset to peak of disease. (n=22, R2=0.7195, P<0.0001, F-test). (f) Quantification of cell body size of non-clustered GFP+ cells in control (n=5), pre-onset (n=6), peak (n=9), and chronic (n=4) EAE. On average 250 GFP+ cells were measured per group. Values are mean±s.e.m., *P<0.05, ***P<0.001 (one-way ANOVA).
Figure 2
Figure 2. Cluster formation and progression over the course of EAE.
(a) 3D reconstruction of a representative spinal cord volume imaged in vivo from the pial surface to 75 μm deep shows a pial vessel (red) in longitudinal orientation that turns perpendicularly and penetrates the spinal cord parenchyma (left). Overlay of the green channel shows the spatial relationship between GFP-positive cells and the vessel at the peak of EAE (middle). A full rotation showing the same volume of tissue from bottom to top shows increased accumulation of perivascular microglia around the parenchymal segment of the blood vessel (dotted line, right). The deepest point of the penetrating vessel is marked with white stars. Grid scale, 14 μm. See corresponding Supplementary Movie 2. (b) Time-lapse in vivo imaging showing pial macrophages and microglia rapidly associating with the vasculature at the peak of EAE. (Left) The leading edge of individual cell bodies or processes closest to the vasculature was tracked over a period of 60 min. Blue tracks identify cells that maintained their proximity to the vasculature and magenta tracks identify cells that either moved closer to the vasculature or extended processes toward it. (Middle and right) Yellow arrowheads show a cell approaching the blood vessel and associating with pre-existing perivascular cells over time. Blue arrowheads show a cell with processes already in contact with the blood vessel that migrates towards the vessel and eventually extends a new process toward it. Red star identifies a cell that maintains its point of contact with the vessel wall throughout the 60-min time course (white arrowheads), while it extends a new process toward the same blood vessel (magenta arrowheads), and retracts one of its processes that was directed away from the vessel (red arrowheads). Scale bar, 10 μm. See corresponding Supplementary Movie 3. (c) Repetitive in vivo imaging in the same spinal cord area 21 and 32 days after immunization shows a newly formed perivascular cluster (solid oval) on one side of a blood vessel and a resolving cluster (dotted oval) on the opposite side of the same vessel. Scale bar, 10 μm.
Figure 3
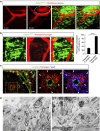
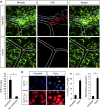
Figure 3. Microglial clusters form in areas of BBB disruption and perivascular fibrin deposition.
(a) In vivo time-lapse imaging in the spinal cord of Cx3cr1GFP/+ EAE mice at the onset of clinical symptoms (clinical score 1) identified sites of active BBB disruption correlating with perivascular clusters. Imaging started immediately after a bolus i.v. injection of a 70 kDa rhodamine dextran solution (red). As time progressed, dye continuously leaked in the perivascular tissue that was occupied by an extensive microglial cluster (green). Scale bar, 20 μm. See corresponding Supplementary Movie 4. (b) In vivo imaging of microglial clusters (green) in the spinal cord of Cx3cr1GFP/+ EAE-challenged mice after 3–7 daily i.v. injections of Alexa594-fibrinogen (red). Cluster formation overlaps with areas of perivascular fibrin deposition at the peak of EAE. The 91.8% calculated proportion of extracellular fibrin that colocalizes with microglia is significantly higher than the 30.6% predicted by Fisher’s combined probability test if the correlation were random. Bar graph represents mean±s.e.m. from 20 clusters from n=8 mice injected with Alexa594-fibrinogen (****P<0.0001, paired t-test). Scale bar, 10 μm. (c) Double immunofluorescence of laminin (basal membranes, green) and fibrin (red) shows fibrin deposition in the Virchow Robins space (arrows) as well as parenchymally (arrowheads, boxed area). Higher magnification images of the boxed area show parenchymal fibrin deposition correlating with perivascular inflammation shown with DAPI staining (blue). Scale bars, left: 30 μm; right: 10 μm. (d) Left: Correlated EM within the perivascular space of an inflamed spinal cord vessel shows abundant deposition of densely packed fibrillar material, consistent in ultrastructure with precipitated fibrin. The spinal cord parenchyma shows demyelinated fibers and dystrophic axons. Right: The perivascular space of a larger vessel contains abundant extracellular fibrillar material and macrophage/microglial cells with intracytoplasmatic lipid degradation products. (E, endothelial cell; F, fibrin; M, macrophage/microglia; GL, astrocytes of the glia limitans; BV, blood vessel; L, leukocyte, arrows: demyelinated/partly dystrophic axons). Scale bars, 2 μm.
Figure 4
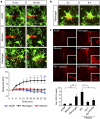
Figure 4. Fibrinogen induces microglial responses in the healthy mouse cortex in vivo.
(a) Local injection of fibrinogen (3–6 mg ml−1, red) in the cortex of the Cx3cr1GFP/+ mice causes microglial process extension (green) toward the tip of the injection electrode; control electrodes containing ACSF, or albumin (5 mg ml−1) caused little or no microglial responses. Quantification of microglial responses over 30 min toward the tip of the electrode upon injection of ACSF (n=7), albumin (n=6), or fibrinogen (n=9). (*P<0.05, **P<0.01, ***P<0.001, two-way analysis of variance (ANOVA)). Scale bar, 10 μm. See corresponding Supplementary Movie 5. (b) Sustained and prolonged microglial response in mouse cortex after a single injection of fibrinogen. Fibrinogen injected at a high concentration (6–10 mg ml−1, red) forms a deposit that is surrounded by microglial processes. The size of the fibrin deposit remains unaltered, and the microglial response to fibrin persists for at least 6 h. Scale bar, 10 μm. (c) Microglial immunoreactivity (Iba-1, red) and quantification from mouse brain sections 3 days after stereotactic injections of fibrinogen, ACSF or albumin protein control, or plasma isolated from wt, Fib−/−, Fibγ390-396A mice (n=6 mice per condition). Bar graph represents mean±s.e.m. (*P<0.05, **P<0.01, one-way ANOVA). Scale bar, 300 μm.
Figure 5
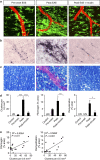
Figure 5. Perivascular cluster formation requires fibrin deposition and precedes demyelination.
Representative in vivo images (a) and correlated histology (b,c) from the same mice are shown at pre-onset EAE, peak EAE, and peak EAE after hirudin administration. (a) In vivo imaging of microglial clusters (green) in relation to the vasculature (red) in the mouse EAE spinal cord. Scale bar, 10 μm. (b) Fibrinogen immunoreactivity. Scale bar, 10 μm. (c) Myelin staining with LFB (blue) counterstained with PAS (phagocytes, purple). Scale bar, 10 μm. (d) Number of clusters, fibrinogen immunoreactivity and demyelination in the spinal cord of healthy, EAE, and hirudin-treated mice. In healthy controls (n=5), microglial clusters, fibrin and demyelination were undetectable (UN). In pre-onset EAE (n=5), microglial clusters and fibrin were present, but there was no demyelination. At the peak of EAE, there was an increase in microglial clusters (n=9), fibrin deposition (n=7) and demyelination (n=8). At the peak of EAE in hirudin-treated mice (n=9), microglial clusters, fibrin deposition and demyelination were significantly reduced. Values are mean±s.e.m. **P<0.01, ***P<0.001 (one-way analysis of variance (ANOVA)), *P<0.05 (Mann–Whitney test). (e) Correlation analysis of the number of clusters with fibrin deposition (n= 15, R2=0.5054, P<0.01, F-test) and demyelination (n=16, R2=0.5692, P<0.001, F-test).
Figure 6
Figure 6. Fibrinogen is required for development of axonal damage in neuroinflammation.
(a) Simultaneous in vivo imaging of GFP-expressing microglia (green), CFP-expressing axons (cyan) and Alexa594-fibrinogen-injected blood vessels (red) in the EAE spinal cord. Axonal damage in the form of blebbing, bending, constrictions and fragmentation (arrowheads) is evident mostly near perivascular microglial clusters, in areas with fibrin deposits. Scale bar, 10 μm. (b) In vivo imaging shows reduced microglial clustering and axonal deformities after anticoagulant treatment. In healthy control (n=5), microglia show even distribution between structurally intact axons. At the peak of EAE (n=9), there are extensive signs of axonal structural abnormalities within areas of microglial clusters. At the peak of EAE, the anticoagulant hirudin (n=12) significantly reduces microglial clustering and morphologic signs of axonal damage. See corresponding Supplementary Movies 8 and 9. Correlated histology using SMI-32, a marker of axonal damage, performed in the same spinal cord area imaged in vivo, shows a decrease of SMI-32-labelled axons in the hirudin-treated mice (n=11), compared with untreated mice at the peak of EAE (n=8). Values are mean±s.e.m. *P<0.05 (one-way analysis of variance (ANOVA)). Scale bars, top: 10 μm; bottom: 50 μm. (c) High resolution confocal microscopy of SMI-32 stained spinal cord sections shows engulfment of axonal fragments (red) by microglia (green). Boxed area is shown in x/y, x/z and y/z projections to confirm the intracellular localization of an axonal fragment within a microglial cell body. Scale bars, left: 10 μm; right: 2 μm. (d) Correlation analysis of the number of clusters with axonal damage (n=16, R2=0.8804, P<0.0001, F-test).
Figure 7
Figure 7. Fibrin induces ROS generation in microglia.
(a) In vivo imaging of microglial clusters (green) in the spinal cord of Cx3cr1GFP/+ EAE-challenged mice after 2 daily i.v. injections of the superoxide indicator dihydroethidium (DHE, red). A significant increase of DHE signal was detected within clustered areas (blue dotted line) compared with neighboring non-clustered areas in the same animals at the peak of EAE, as well as to healthy controls. White dotted lines outline blood vessels. Bar graph represents mean±s.e.m. from n=4 mice (*P<0.05, Mann–Whitney test). Scale bar, 20 μm. (b) H2O2 production shown by the PYME probe (green) in BV2 microglia labeled with IsoB4 (red) after treatment with fibrin D-dimer. Quantification of cells positive for H2O2 expressed as a percentage of total cell number. Values are mean±s.e.m. from untreated, n=6 wells, 1481 cells counted; fibrin D-dimer, n=7 wells, 1172 cells counted, **P<0.01 (Mann–Whitney test). Real-time PCR of iNOS gene expression in BV2 cell extracts upon fibrinogen treatment. n=2 independent experiments performed in triplicates, *P<0.05 (Mann–Whitney test). Scale bar, 50 μm.
Figure 8
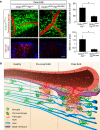
Figure 8. Fibrinogen mediates perivascular microglial clustering and axonal damage via CD11b/CD18.
(a) In vivo imaging of Cx3cr1GFP/+Fibγ390-396A mice at the peak of EAE (n=6) shows fewer perivascular clusters (top) and significantly less SMI-32 immunoreactivity (bottom) than in Cx3cr1GFP/+Fib+/+ controls (n=9). Correlated histology was performed in the same spinal cord areas in the mice that were previously imaged in vivo. Values are mean±s.e.m. *P<0.05 (Mann–Whitney test). Scale bars, top: 10 μm; bottom: 50 μm. (b) Schematic illustration and working model of the dynamic responses of perivascular microglia and pial macrophages to BBB disruption and their contribution to axonal damage in neuroinflammatory disease. In the healthy CNS, microglia are evenly distributed and stochastically extend and retract their processes. In EAE mice before the onset of neurological symptoms fibrinogen leaks in the CNS, triggering microglial process extension and cell body accumulation toward the vasculature. At the peak of disease, microglial clustering around the vasculature occurs almost exclusively in areas of fibrin deposition and is associated with axonal damage and release of ROS by microglia. Fibrinogen signaling via the CD11b/CD18 integrin receptor is required for the formation of perivascular clusters and the development of axonal damage.

Similar articles

Cited by

References

    1. Lassmann H., Bruck W., Lucchinetti C. Heterogeneity of multiple sclerosis pathogenesis: implications for diagnosis and therapy. Trends. Mol. Med. 7, 115–121 (2001). - PubMed
    1. Marik C., Felts P. A., Bauer J., Lassmann H., Smith K. J. Lesion genesis in a subset of patients with multiple sclerosis: a role for innate immunity? Brain 130, 2800–2815 (2007). - PMC - PubMed
    1. Vos C. M. et al. Blood-brain barrier alterations in both focal and diffuse abnormalities on postmortem MRI in multiple sclerosis. Neurobiol. Dis. 20, 953–960 (2005). - PubMed
    1. Garcia A. D., Doan N. B., Imura T., Bush T. G., Sofroniew M. V. GFAP-expressing progenitors are the principal source of constitutive neurogenesis in adult mouse forebrain. Nat. Neurosci. 7, 1233–1241 (2004). - PubMed
    1. van der Valk P., Amor S. Preactive lesions in multiple sclerosis. Curr. Opin. Neurol. 22, 207–213 (2009). - PubMed

Publication types

MeSH terms