Single low-dose cyclophosphamide combined with interleukin-12 gene therapy is superior to a metronomic schedule in inducing immunity against colorectal carcinoma in mice
- PMID: 23170252
- PMCID: PMC3494618
- DOI: 10.4161/onci.20684
Single low-dose cyclophosphamide combined with interleukin-12 gene therapy is superior to a metronomic schedule in inducing immunity against colorectal carcinoma in mice
Abstract
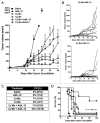
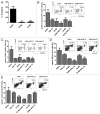
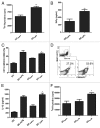
The use of conventional cytotoxic agents at metronomic schedules, alone or in combination with targeted agents or immunotherapy, is being explored as a promising anticancer strategy. We previously reported a potent antitumor effect of a single low-dose cyclophosphamide and interleukin-12 (IL-12) gene therapy against advanced gastrointestinal carcinoma, in mice. Here, we assessed whether the delivery of IL-12 by gene therapy together with metronomic cyclophosphamide exerts antitumor effects in a murine model of colorectal carcinoma. This combination therapy was able, at least in part, to reverse immunosuppression, by decreasing the number of regulatory T cells (Tregs) as well as of splenic myeloid-derived suppressor cells (MDSCs). However, metronomic cyclophosphamide plus IL-12 gene therapy failed to increase the number of tumor-infiltrating T lymphocytes and, more importantly, to induce a specific antitumor immune response. With respect to this, cyclophosphamide at a single low dose displayed a superior anticancer profile than the same drug given at a metronomic schedule. Our results may have important implications in the design of new therapeutic strategies against colorectal carcinoma using cyclophosphamide in combination with immunotherapy.
Figures


Similar articles
-
Reversal of gastrointestinal carcinoma-induced immunosuppression and induction of antitumoural immunity by a combination of cyclophosphamide and gene transfer of IL-12.Mol Oncol. 2011 Jun;5(3):242-55. doi: 10.1016/j.molonc.2011.03.007. Epub 2011 Apr 5. Mol Oncol. 2011. PMID: 21515097 Free PMC article.
-
Synergistic effect of metronomic dosing of cyclophosphamide combined with specific antitumor immunotherapy in a murine melanoma model.Cancer Res. 2003 Dec 1;63(23):8408-13. Cancer Res. 2003. PMID: 14679003
-
Metronomic cyclophosphamide eradicates large implanted GL261 gliomas by activating antitumor Cd8+ T-cell responses and immune memory.Oncoimmunology. 2015 Feb 18;4(4):e1005521. doi: 10.1080/2162402X.2015.1005521. eCollection 2015 Apr. Oncoimmunology. 2015. PMID: 26137402 Free PMC article.
-
Metronomic chemotherapy: A potent macerator of cancer by inducing angiogenesis suppression and antitumor immune activation.Cancer Lett. 2017 Aug 1;400:243-251. doi: 10.1016/j.canlet.2016.12.018. Epub 2016 Dec 23. Cancer Lett. 2017. PMID: 28017892 Review.
-
Immunogenic chemotherapy: Dose and schedule dependence and combination with immunotherapy.Cancer Lett. 2018 Apr 10;419:210-221. doi: 10.1016/j.canlet.2018.01.050. Cancer Lett. 2018. PMID: 29414305 Free PMC article. Review.
Cited by
-
Chloroquine and hydroxychloroquine for cancer therapy.Mol Cell Oncol. 2014 Jul 15;1(1):e29911. doi: 10.4161/mco.29911. eCollection 2014. Mol Cell Oncol. 2014. PMID: 27308318 Free PMC article. Review.
-
Immunostimulatory activity of lifespan-extending agents.Aging (Albany NY). 2013 Nov;5(11):793-801. doi: 10.18632/aging.100619. Aging (Albany NY). 2013. PMID: 24389041 Free PMC article. Review.
-
Trial watch: Chemotherapy with immunogenic cell death inducers.Oncoimmunology. 2013 Mar 1;2(3):e23510. doi: 10.4161/onci.23510. Oncoimmunology. 2013. PMID: 23687621 Free PMC article.
-
Metronomics: towards personalized chemotherapy?Nat Rev Clin Oncol. 2014 Jul;11(7):413-31. doi: 10.1038/nrclinonc.2014.89. Epub 2014 Jun 10. Nat Rev Clin Oncol. 2014. PMID: 24913374 Review.
-
Metronomic chemotherapy: bridging theory to clinical application in canine and feline oncology.Front Vet Sci. 2024 Jun 6;11:1397376. doi: 10.3389/fvets.2024.1397376. eCollection 2024. Front Vet Sci. 2024. PMID: 38903691 Free PMC article. Review.
References
-
- Croci DO, Zacarías Fluck MF, Rico MJ, Matar P, Rabinovich GA, Scharovsky OG. Dynamic cross-talk between tumor and immune cells in orchestrating the immunosuppressive network at the tumor microenvironment. Cancer Immunol Immunother. 2007;56:1687–700. doi: 10.1007/s00262-007-0343-y. - DOI - PMC - PubMed
Publication types
LinkOut - more resources
Full Text Sources
