

Adipose-specific deletion of TFAM increases mitochondrial oxidation and protects mice against obesity and insulin resistance
- PMID: 23168219
- PMCID: PMC3529641
- DOI: 10.1016/j.cmet.2012.10.016
Adipose-specific deletion of TFAM increases mitochondrial oxidation and protects mice against obesity and insulin resistance
Abstract
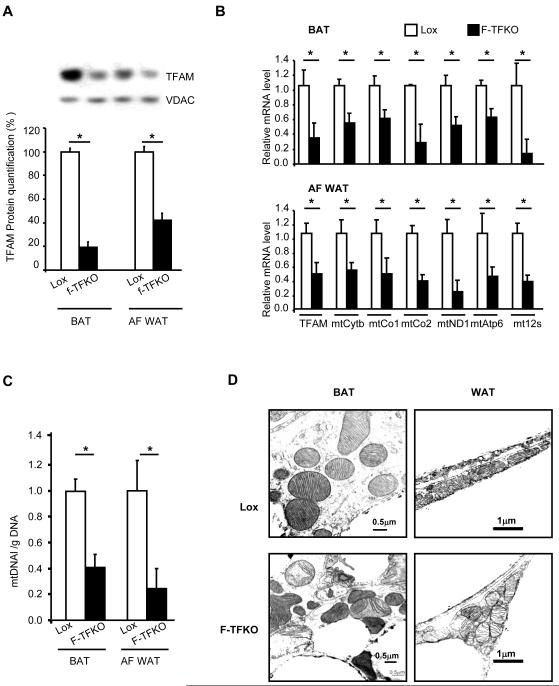
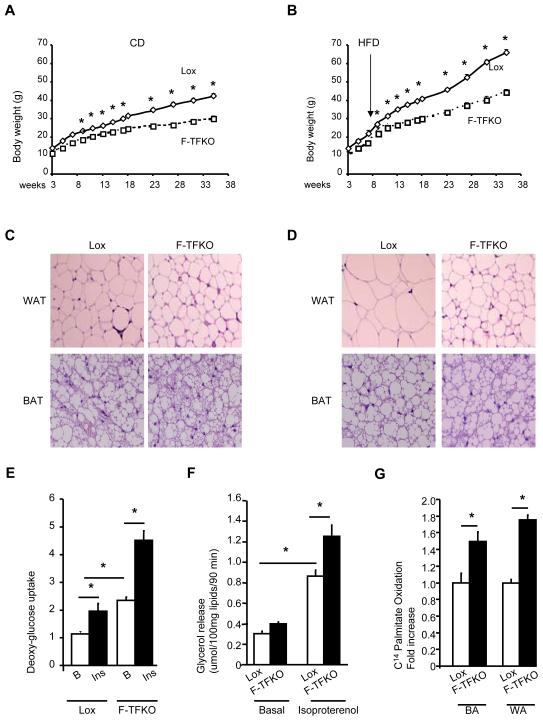
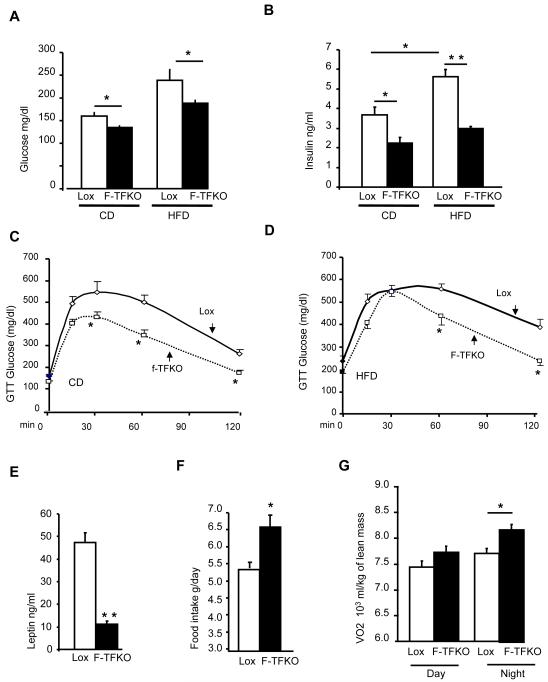
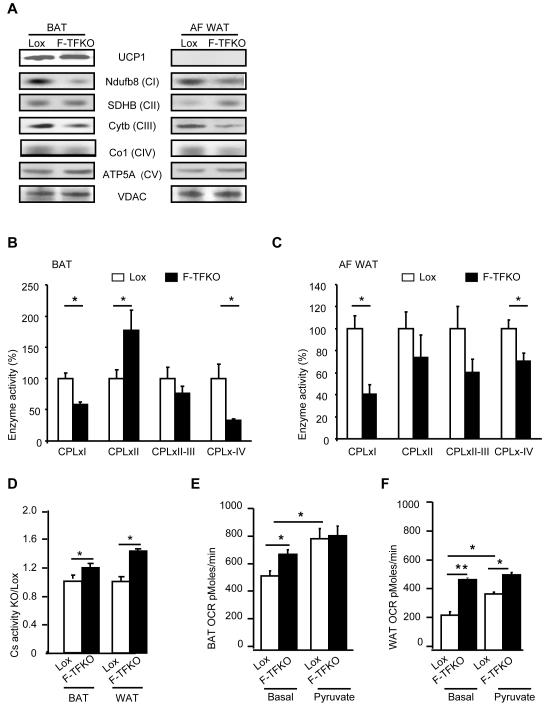
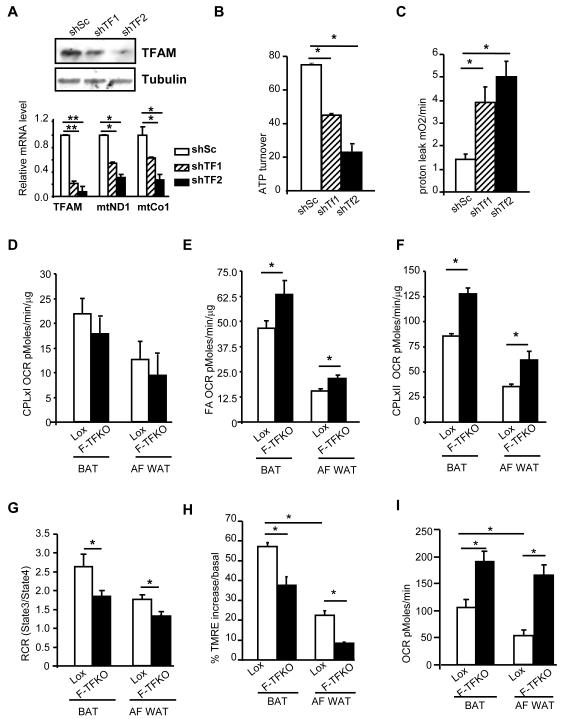
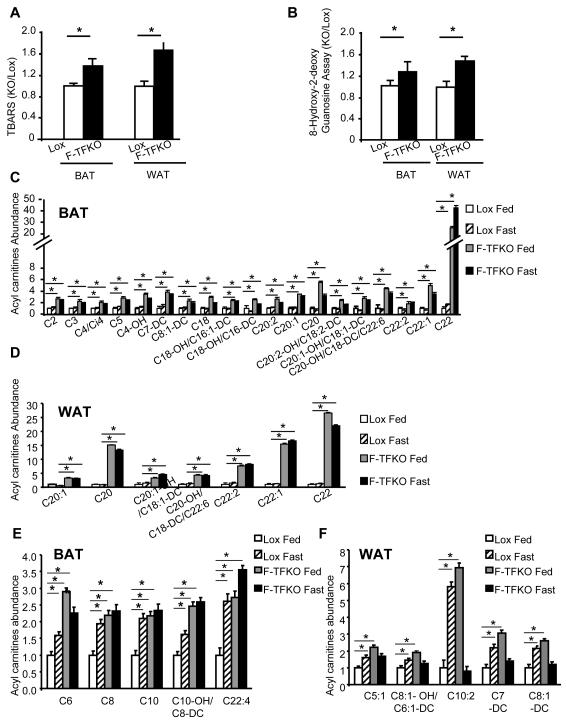
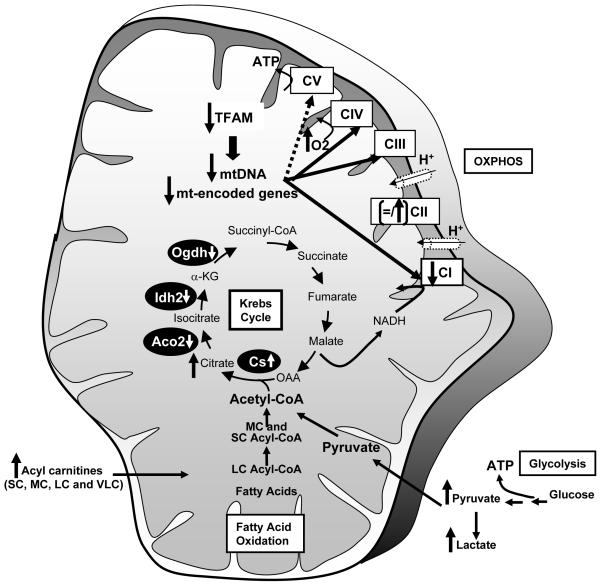
Obesity and type 2 diabetes are associated with mitochondrial dysfunction in adipose tissue, but the role for adipose tissue mitochondria in the development of these disorders is currently unknown. To understand the impact of adipose tissue mitochondria on whole-body metabolism, we have generated a mouse model with disruption of the mitochondrial transcription factor A (TFAM) specifically in fat. F-TFKO adipose tissue exhibit decreased mtDNA copy number, altered levels of proteins of the electron transport chain, and perturbed mitochondrial function with decreased complex I activity and greater oxygen consumption and uncoupling. As a result, F-TFKO mice exhibit higher energy expenditure and are protected from age- and diet-induced obesity, insulin resistance, and hepatosteatosis, despite a greater food intake. Thus, TFAM deletion in the adipose tissue increases mitochondrial oxidation that has positive metabolic effects, suggesting that regulation of adipose tissue mitochondria may be a potential therapeutic target for the treatment of obesity.
Copyright © 2012 Elsevier Inc. All rights reserved.
Figures
Similar articles
-
Identification of a novel toxicophore in anti-cancer chemotherapeutics that targets mitochondrial respiratory complex I.Elife. 2020 May 20;9:e55845. doi: 10.7554/eLife.55845. Elife. 2020. PMID: 32432547 Free PMC article.
-
Depressing time: Waiting, melancholia, and the psychoanalytic practice of care.In: Kirtsoglou E, Simpson B, editors. The Time of Anthropology: Studies of Contemporary Chronopolitics. Abingdon: Routledge; 2020. Chapter 5. In: Kirtsoglou E, Simpson B, editors. The Time of Anthropology: Studies of Contemporary Chronopolitics. Abingdon: Routledge; 2020. Chapter 5. PMID: 36137063 Free Books & Documents. Review.
-
GLIS3: A novel transcriptional regulator of mitochondrial functions and metabolic reprogramming in postnatal kidney and polycystic kidney disease.Mol Metab. 2024 Dec;90:102052. doi: 10.1016/j.molmet.2024.102052. Epub 2024 Nov 5. Mol Metab. 2024. PMID: 39505148 Free PMC article.
-
Sexual dimorphism in the effects of maternal adipose tissue growth hormone receptor deficiency on offspring metabolic health.Biol Sex Differ. 2024 Dec 2;15(1):98. doi: 10.1186/s13293-024-00676-2. Biol Sex Differ. 2024. PMID: 39623508 Free PMC article.
-
Antioxidants for female subfertility.Cochrane Database Syst Rev. 2017 Jul 28;7(7):CD007807. doi: 10.1002/14651858.CD007807.pub3. Cochrane Database Syst Rev. 2017. Update in: Cochrane Database Syst Rev. 2020 Aug 27;8:CD007807. doi: 10.1002/14651858.CD007807.pub4. PMID: 28752910 Free PMC article. Updated. Review.
Cited by
-
Role of Energy Metabolism in the Brown Fat Gene Program.Front Endocrinol (Lausanne). 2015 Jun 30;6:104. doi: 10.3389/fendo.2015.00104. eCollection 2015. Front Endocrinol (Lausanne). 2015. PMID: 26175716 Free PMC article. Review.
-
Mitochondrial quality control in cardiac ischemia/reperfusion injury: new insights into mechanisms and implications.Cell Biol Toxicol. 2023 Feb;39(1):33-51. doi: 10.1007/s10565-022-09716-2. Epub 2022 Aug 11. Cell Biol Toxicol. 2023. PMID: 35951200 Review.
-
p32 heterozygosity protects against age- and diet-induced obesity by increasing energy expenditure.Sci Rep. 2017 Jul 18;7(1):5754. doi: 10.1038/s41598-017-06209-9. Sci Rep. 2017. PMID: 28720899 Free PMC article.
-
Pharmacological approaches to restore mitochondrial function.Nat Rev Drug Discov. 2013 Jun;12(6):465-83. doi: 10.1038/nrd4023. Epub 2013 May 13. Nat Rev Drug Discov. 2013. PMID: 23666487 Free PMC article. Review.
-
Cannabidiol promotes browning in 3T3-L1 adipocytes.Mol Cell Biochem. 2016 May;416(1-2):131-9. doi: 10.1007/s11010-016-2702-5. Epub 2016 Apr 11. Mol Cell Biochem. 2016. PMID: 27067870
References
-
- Abel ED, Peroni O, Kim JK, Kim YB, Boss O, Hadro E, Minnemann T, Shulman GI, Kahn BB. Adipose-selective targeting of the GLUT4 gene impairs insulin action in muscle and liver. Nature. 2001;409:729–733. - PubMed
-
- Ahima RS. Adipose tissue as an endocrine organ. Obesity (Silver. Spring.) 2006;14(Suppl 5):242S–249S. - PubMed
-
- Attane C, Foussal C, Le GS, Benani A, Daviaud D, Wanecq E, Guzman-Ruiz R, Dray C, Bezaire V, Rancoule C, Kuba K, Ruiz-Gayo M, Levade T, Penninger J, Burcelin R, Penicaud L, Valet P, Castan-Laurell I. Apelin treatment increases complete Fatty Acid oxidation, mitochondrial oxidative capacity, and biogenesis in muscle of insulin-resistant mice. Diabetes. 2012;61:310–320. - PMC - PubMed
-
- Baris OR, Klose A, Kloepper JE, Weiland D, Neuhaus JF, Schauen M, Wille A, Muller A, Merkwirth C, Langer T, Larsson NG, Krieg T, Tobin DJ, Paus R, Wiesner RJ. The mitochondrial electron transport chain is dispensable for proliferation and differentiation of epidermal progenitor cells. Stem Cells. 2011;29:1459–1468. - PubMed
Publication types
MeSH terms
Substances
Grants and funding
LinkOut - more resources
Full Text Sources
Other Literature Sources
Medical
Molecular Biology Databases
Research Materials
