. 2012 Dec 28;48(6):914-25.
doi: 10.1016/j.molcel.2012.10.011. Epub 2012 Nov 15.

VE-cadherin signaling induces EB3 phosphorylation to suppress microtubule growth and assemble adherens junctions

Affiliations

VE-cadherin signaling induces EB3 phosphorylation to suppress microtubule growth and assemble adherens junctions

Yulia A Komarova et al. Mol Cell. .

Abstract

Vascular endothelial (VE)-cadherin homophilic adhesion controls endothelial barrier permeability through assembly of adherens junctions (AJs). We observed that loss of VE-cadherin-mediated adhesion induced the activation of Src and phospholipase C (PLC)γ2, which mediated Ca(2+) release from endoplasmic reticulum (ER) stores, resulting in activation of calcineurin (CaN), a Ca(2+)-dependent phosphatase. Downregulation of CaN activity induced phosphorylation of serine 162 in end binding (EB) protein 3. This phospho-switch was required to destabilize the EB3 dimer, suppress microtubule (MT) growth, and assemble AJs. The phospho-defective S162A EB3 mutant, in contrast, induced MT growth in confluent endothelial monolayers and disassembled AJs. Thus, VE-cadherin outside-in signaling regulates cytosolic Ca(2+) homeostasis and EB3 phosphorylation, which are required for assembly of AJs. These results identify a pivotal function of VE-cadherin homophilic interaction in modulating endothelial barrier through the tuning of MT dynamics.


Figures

Figure 1
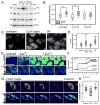
Figure 1. MT growth dynamics in endothelial monolayers with intact or disassembled VE-cadherin-mediated adhesion
(A, C, and E) MT growth tracks classified by growth speed and growth lifetime using PlusTipTracker software; (A) confluent HPAECs; (C) during re-establishing (0–30 min extracellular Ca2+ back); or (E) destabilization of VE-cadherin-mediated adhesion with anti-VE-cadherin-mediated adhesion peptide that blocks trans interaction (see Figure S1). Relative proportions of sub-populations are shown by their corresponding color on left. Disruption of VE-cadherin-mediated adhesion (C and E) induced fast and persistent MT growth (long-lived MT tracks; blue). Scale bar, 10 μm. (B, D, and F) Growth length distributions for MTs outgrowing from the cell center for corresponding groups. Increased number of long tracks is consistent with increased number of fast and long-lived MT growth. (G) Bar graph of growth length (56, 87, 101 and 159 tracks) and (H) percentile of long-lived MT growth (sum of blue and green tracks; n=10 cells per group); mean ± S.D.; **, p=0.005 and ***, p=0.0001.
Figure 2
Figure 2. Dissassembly of VE-cadherin-mediated adhesion increases intracellular [Ca2+]i via Src-PLCγ2 signaling
(A) Time-course of Src activation during reversible disassembly of VE-cadherin-mediated adhesion in HPAECs by Ca2+ switch protocol. −[ Ca2+ ], depletion of extracellular Ca2+; +[ Ca2+ ], Ca2+ back. Cell lysates were probed with p-Tyr416, p-Tyr530, and Src Abs. Destabilization of VE-cadherin-mediated adhesion increased Tyr416 and decreased Tyr530 phosphorylation. (B) LIBRA vIIS (CFP/FRET ratio) as a measure of IP3 synthesis in HPAECs monolayer with intact (confluent) and destabilized VE-cadherin-mediated adhesion (1 min of Ca2+ -free media). PLCγ2 KD inhibited IP3 production as mediated by depletion of extracellular Ca2+; PLCγ1 KD reduced only basal level of IP3. −[Ca 2+], absence of extracellular Ca2+; n= 10–15 cells/group; mean ± S.D.; ** p=0.002. (C) Fluor-4 fluorescence in HPAEC monolayer with intact and destabilized VE-cadherin-mediated adhesion; extracellular Ca2+ switch (1–30 min of Ca2+ back) or 1 hr treatment with SP or SP control and (D) quantification of the data; 102, 114, 132 and 208 cells per group; mean ± S.D.; ***, p=0.0001 vs. confluent monolayer and SP control. Scale bar, 10 μm. (E) Fura-2AM 340/380 ratiometric images in cells subjected to extracellular Ca2+ switch and (F) changes in intracellular [Ca 2+]i. Scale bar, 10 μm. Increase in free [Ca2+]i was observed after depletion of extracellular Ca2+ (−[Ca 2+]) and as the extracellular Ca2+ concentration was increased to 1.5 mM (+[Ca 2+]). Pretreatment of cells with 2-APB or U73122 significantly reduced the rise in free [Ca2+]i. (G) [Ca2+]ER was measured with Cameleon D1ER (see Methods) in confluent HPAECs, at 2 minute of Ca2+ depletion (-[Ca 2+]) and 15 minutes after Ca2+-add-back (+[Ca 2+]) and (H) quantification of the data. Scale bar, 10 μm. Depletion of extracellular Ca2+ reduced [Ca2+]ER; n=15 cells/group; mean ± S.D.; ***, p=0.0001.
Figure 3
Figure 3. VE-cadherin-mediated adhesion regulates EB3 phosphorylation
(A) EB3 undergoes reversible phosphorylation on serine residues. HPAECs underwent Ca2+ switch protocol or treatment with SP or SP control peptide for 1 hr. EB3 precipitates probed for phospho-serine and EB3 using Western Blot and quantification are shown; mean ± S.D.; n=4; *, p=0.05. EB3 serine phosphorylation was reduced indicating dephosphorylation following depletion of extracellular Ca2+ or SP addition; however, EB3 serine phosphorylation was observed after Ca2+-add-back (at 30 and 60 min) and with control SP. (B) EB3 dephosphorylation requires Src and PLCγ2 activities. HPAECs were depleted of PLCγ1 and PLCγ2 or treated with indicated inhibitors and subjected to Ca2+ switch; after Ca2+-add-back (+[Ca 2+]) is shown. EB3 phosphorylation was detected as in A. Western Blot and quantification are shown; mean ± S.D.; n=3; *, p=0.05. Inhibition of Src and PLC activities and PLCγ2 KD inhibited EB3 dephosphorylation following destabilization of VE-cadherin-mediated adhesion. (C) EB3 dephosphorylation requires CaN activity. HPAECs were depleted of CaN B1 and B2 (Figure S3) or pretreated with CsA (IC50=65 nM), FK506 (IC50=25 nM), or autoinhibitory peptide (described in Methods) at indicated concentrations and subjected to Ca2+ switch protocol. EB3 phosphorylation at 15 min of Ca2+-add-back was determined as in A. Western Blot and quantification are shown; mean ± S.D.; n=3; *, p=0.05. Inhibition of CaN induced higher level of EB3 serine phosphorylation.
Figure 4
Figure 4. EB3 forms a ternary complex with CaM1 and CaN and undergoes dephosphorylation at S162
(A–B) Endogenous EB3 and CaM1 were immunoprecipitated from HPAEC lysates. Resultant precipitates were probed for CaN, EB3, EB1, and CaM1; − [Ca2+], 10 min of Ca2+ depletion; +[Ca2+], Ca2+-add-back for indicated times. EB3 formed a complex with CaN and Ca2+-bound CaM1 (16kD); arrowheads indicate CaN and EB3; note, ~25 and 50kD bands are non-specific detection of IgG. (C) Representation of EB3 deletion and EB2/EB3 chimera mutants. (D) Interaction between EB3-YFP mutants indicated in (C) with CaN and CaM1. EB3 mutants were transiently expressed in HMEC-1 and immunoprecipitated with α-GFP Ab and resulting precipitates were probed for CaN and CaM1; EB3 mutants were detected with α-GFP in cell lysate. (E) Mutation of S162 abolished EB3 phosphorylation. GFP-EB3 and its mutants, S162A and S176A, were transiently expressed in HEK 293 cells, immunoprecipitated with α-GFP Ab, and resulting precipitates were probed for phospho-serine and GFP. (F) EB3 undergoes reversible phosphorylation on S162 residue. HPAEC monolayers were treated as in Figure 3A and cell lysates were probed with phospho-S162-specific Ab and EB3. Western Blot and quantification are shown; mean ± S.D.; n=4; *, p=0.05. (G) EB3 undergoes de-phosphorylation on S162 in lung endothelium during inflammation and injury. Mice were given LPS intraperintoneally for indicated times and endothelial-specific lysates from lungs were probed for phospho-S162 and total EB3 using polyclonal rabbit Abs developed in this study; mean ± S.D.; n=4; *, p=0.05.
Figure 5
Figure 5. EB3 phosphorylation regulates stability of the dimer and persistent MT growth
(A–E) EB3-S162A mutant promotes persistent MT growth in confluent monolayers. Tracks of S162E (A) and S162A (B) mutants in HPAECs (as in Figure 1). Scale bar, 10 μm. Expression of S162A induced MT growth whereas expression of S162E mutant had no effect. (C–D) Growth length distribution for S162E (C) and S162A (D) tracks outgrowing from the cell center. (E) Percentile of long-lived growth (n=10 cells/group); mean ± S.D.; **, p=0.0015. (F) The time-dependent increase in FRET after mixing EB3-CFP and EB3-YFP (blue), EB3-S162E-CFP and EB3-S162E-YFP (green), EB3-S162E-CFP and EB3-YFP (red). Average of three experiments (dark) and the best fit are shown (see Material and Methods).
Figure 6
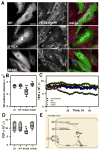
Figure 6. Phospho-defective EB3 S162A mutant decreases VE-cadherin-mediated adhesion and disrupts AJ barrier
(A) Immunofluorescent staining of HPAECs expressing EB3, S162A, or S162E mutants. VE-cadherin (red), GFP (green), and nuclei (blue). Bar, 10 μm. Arrowheads show disruption of AJs in cells expressing EB3 S162A. (B) Quantification of VE-cadherin expression at AJs; (UT -untransfected cells); n=20 images per group; mean ± S.D.; ***, p=0.0001. Expression of S162A mutant decreased VE-cadherin expression at AJs, which was coupled to opening of AJs (A). (C) Real-time transendothelial electrical resistance (TER) measurement in HPAECs expressing EB3 or either of the two mutants. Cells grown to 90% confluence were transfected 30 min prior to TER measurements with indicated EB3 plasmids; mean values over time are shown; n= 12. (D) Expression of S162A resulted in TER that decreased at 25 hr of transfection. Data are represented as in B; **, p=0.0028. Decrease in TER represents a marked disruption of AJ barrier in cells expressing EB3 S162A. (E) Model illustrating VE-cadherin outside-in signaling. VE-cadherin homophilic adhesion induces recruitment of Csk to the site of nascent adhesion and inhibits Src, downregulates PLCγ2 activity, and induces EB3 phosphorylation. This signaling is translated to non-persistent MT growth, maintenance of cell shape, and stable VE-cadherin-mediated adhesion.

Similar articles

Cited by

References

    1. Ades EW, Candal FJ, Swerlick RA, George VG, Summers S, Bosse DC, Lawley TJ. HMEC-1: establishment of an immortalized human microvascular endothelial cell line. The Journal of investigative dermatology. 1992;99:683–690. - PubMed
    1. Akhmanova A, Hoogenraad CC. Microtubule plus-end-tracking proteins: mechanisms and functions. Curr Opin Cell Biol. 2005;17:47–54. - PubMed
    1. Akhmanova A, Steinmetz MO. Tracking the ends: a dynamic protein network controls the fate of microtubule tips. Nat Rev Mol Cell Biol. 2008;9:309–322. - PubMed
    1. Applegate KT, Besson S, Matov A, Bagonis MH, Jaqaman K, Danuser G. plusTipTracker: Quantitative image analysis software for the measurement of microtubule dynamics. Journal of structural biology. 2011;176:168–184. - PMC - PubMed
    1. Bachmaier K, Toya S, Gao X, Triantafillou T, Garrean S, Park GY, Frey RS, Vogel S, Minshall R, Christman JW, et al. E3 ubiquitin ligase Cblb regulates the acute inflammatory response underlying lung injury. Nat Med. 2007;13:920–926. - PubMed

Publication types

MeSH terms