. 2012 Nov 15;26(22):2550-9.
doi: 10.1101/gad.202184.112.

Stable intronic sequence RNA (sisRNA), a new class of noncoding RNA from the oocyte nucleus of Xenopus tropicalis

Affiliations

Stable intronic sequence RNA (sisRNA), a new class of noncoding RNA from the oocyte nucleus of Xenopus tropicalis

Eugene J Gardner et al. Genes Dev. .

Abstract

To compare nuclear and cytoplasmic RNA from a single cell type, free of cross-contamination, we studied the oocyte of the frog Xenopus tropicalis, a giant cell with an equally giant nucleus. We isolated RNA from manually dissected nuclei and cytoplasm of mature oocytes and subjected it to deep sequencing. Cytoplasmic mRNA consisted primarily of spliced exons derived from ∼6700 annotated genes. Nearly all of these genes were represented in the nucleus by intronic sequences. However, unspliced nascent transcripts were not detected. Inhibition of transcription or splicing for 1-2 d had little or no effect on the abundance of nuclear intronic sequences, demonstrating that they are unusually stable. RT-PCR analysis showed that these stable intronic sequences are transcribed from the coding strand and that a given intron can be processed into more than one molecule. Stable intronic sequence RNA (sisRNA) from the oocyte nucleus constitutes a new class of noncoding RNA. sisRNA is detectable by RT-PCR in samples of total RNA from embryos up to the mid-blastula stage, when zygotic transcription begins. Storage of sisRNA in the oocyte nucleus and its transmission to the developing embryo suggest that it may play important regulatory roles during oogenesis and/or early embryogenesis.


Figures
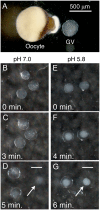
Figure 1.
Figure 1.
Isolation of nuclear and cytoplasmic fractions from oocytes of X. tropicalis. (A) A single mature oocyte of X. tropicalis and the GV that was removed from it. (BD) Behavior of GVs isolated at pH 7.0. The nuclear contents form a weak gel after the GV is removed from the oocyte. Such nuclei lose most of their mass, even though the envelope remains intact (Macgregor 1962). The nuclear envelope can be removed (arrow in D), but the isolated gel is soft and easily dispersed by pipetting. (EG) Behavior of GVs isolated at pH 5.8. Within a few seconds after isolation, the GV becomes opalescent under incident illumination. Then, the envelope expands, leaving a wide space between it and the gelled contents. Note that the GV contents do not decrease appreciably in volume. After the envelope is removed (arrow in G), the firm nuclear gel can be pipetted without damage. Bars, 500 μm.
Figure 2.
Figure 2.
Cytoplasmic and nuclear sequences from a highly expressed gene, nasp (histone H1-binding protein). The predicted exonic and intronic sequences are shown just above the gene name. Solid bars with connecting lines represent the annotated exons (xenTro2). Unconnected solid bars represent introns (see the Materials and Methods for construction of the intron map). The ordinate shows the number of reads per base. Cytoplasmic sequences in the bottom row appear as typical spliced mRNA. The exon boundaries are sharp, except for the tapering 5′ and 3′ ends. The peaks and valleys within the exons presumably reflect systematic biases in library production, sequencing, or sequence alignments, and are more or less reproducible between independent samples. Nuclear sequences in the top row are predominately intronic in origin. Conspicuously absent are nascent transcripts, which would be represented by reads along the entire length of the transcribed region. Note the peaks and valleys in the introns, which are reproducible between samples. Some may be artifacts of sequencing, as in the exons, but some of the more prominent peaks probably reflect separate intronic molecules (see Figs. 4, 5).
Figure 3.
Figure 3.
Nuclear and cytoplasmic RNA sequences are stable for at least 2 d. Shown here are patterns for a typical highly expressed gene, ccne1 (cyclin E1). The ordinates show the number of reads per base. (A, top four rows) Actinomycin D treatment. Oocytes were held for 15–16 h in control OR2 medium or in actinomycin D (20 μg/mL) to inhibit transcription. (First and second rows) The patterns for GV RNA from control and treated oocytes were essentially identical. (Third and fourth rows) The same was true for cytoplasmic RNA. (B, bottom four rows) U2 snRNA depletion. Oocytes were injected with an antisense deoxyoligonucleotide that rapidly destroys U2 snRNA and therefore inhibits splicing. Control oocytes were injected with water. Thirty-six hours to 48 h later, RNA was isolated from GVs and cytoplasm from injected and control oocytes. (Fifth and sixth rows) The patterns for GV RNA were similar for control and U2-depleted oocytes. (Seventh and eighth rows) The same was true for cytoplasmic RNA from control and U2-depleted oocytes.
Figure 4.
Figure 4.
Stable intronic sequences are transcribed from the coding strand but are not part of a nascent transcript. (A) Intronic sequences in GV RNA could be amplified by RT–PCR only when the RT primer recognized the sense strand. Shown here are the RT–PCR results from amplifying the sense and antisense strands for six genes (cropped, in each case, from the same gel). (B) Intronic sequences could be amplified with two primers within an intron but not with one primer in an intron and one in an adjacent exon. At the top of the figure is shown part of the gene model for calm1 (calmodulin 1) and the primers used for RT–PCR. The ordinate shows the number of reads per base. A similar intronic peak was examined for three other genes: nasp (histone H1-binding protein), pcna (proliferating cell nuclear antigen), and aldoc (aldolase C). The primers and corresponding introns are given in Supplemental Table 1.
Figure 5.
Figure 5.
Multiple peaks within a single intron are derived from separate molecules. RT–PCR primers were designed as shown in the gene models for e2f3 (E2F transcription factor 3) and gpbp1/1 (GC-rich promoter-binding protein 1-like 1). Products were obtained when both primers were within one intronic peak but not when one was in one peak and the other was in an adjacent peak. The bands labeled “RNA” are controls to demonstrate that peak 1F and peak 2R primers work when tested on in vitro transcribed RNA (details in the Materials and Methods). Primers are given in Supplemental Table 1. The ordinates show the number of reads per base.
Figure 6.
Figure 6.
Estimating the relative abundance of cytoplasmic exonic and nuclear intronic sequences from the same gene. The method depends on having a superabundant, strictly nuclear transcript derived from an intron, such as a snoRNA. Shown here is the 5′ end of trrap (transformation/transcription domain-associated protein). The ordinates show the number of reads per base. (First and second rows) RNA from a whole oocyte (cytoplasm + GV) and from cytoplasm only. The large intronic peak in the second intron in the top row (RNA from whole oocytes) was derived entirely from the GV, as shown by its absence from the second row, which displays cytoplasmic RNA only. Quantitation of the peak in row 1 shows that it occurs (in the whole oocyte) at roughly twice the molar concentration of the cytoplasmic exonic peaks. (Third and fourth rows) These two rows display the GV sequences from trrap on two different scales (maximum of 9390 and 50 reads, respectively). In the third row, one sees only the superabundant peak because it is roughly 200 times higher than the other intronic peaks. Since this superabundant peak is twice as abundant as the exons and 200 times as abundant as the introns, we can conclude that the exons in the cytoplasm are 100 times as abundant as the introns in the GV. Quantitative estimates for 16 such cases are given in Supplemental Table 2.
Figure 7.
Figure 7.
Intronic sequences persist up to the blastula stage of embryogenesis. To test whether intronic sequences are stable after GV breakdown and fertilization, RT–PCR was carried out on total egg RNA from progesterone-matured oocytes, four- to eight-cell embryos, and blastulae. Intronic sequences were detected in each case. Primers are given in Supplemental Table 1.

Similar articles

Cited by

References

    1. Anderson DM, Smith LD 1978. Patterns of synthesis and accumulation of heterogeneous RNA in lampbrush stage oocytes of Xenopus laevis (Daudin). Dev Biol 67: 274–285 - PubMed
    1. Berget SM, Moore C, Sharp PA 1977. Spliced segments at the 5′ terminus of adenovirus 2 late mRNA. Proc Natl Acad Sci 74: 3171–3175 - PMC - PubMed
    1. Black DL 2003. Mechanisms of alternative pre-messenger RNA splicing. Annu Rev Biochem 72: 291–336 - PubMed
    1. Bowes JB, Snyder KA, Segerdell E, Jarabek CJ, Azam K, Zorn AM, Vize PD 2010. Xenbase: Gene expression and improved integration. Nucleic Acids Res 38: D607–D612 doi: 10.1093/nar/gkp953 - PMC - PubMed
    1. Callan HG. 1986 Lampbrush chromosomes. Springer-Verlag, Berlin.

Publication types