. 2012 Nov 13;22(5):656-67.
doi: 10.1016/j.ccr.2012.08.027.

Crosstalk between ROR1 and the Pre-B cell receptor promotes survival of t(1;19) acute lymphoblastic leukemia

Affiliations

Crosstalk between ROR1 and the Pre-B cell receptor promotes survival of t(1;19) acute lymphoblastic leukemia

Vincent T Bicocca et al. Cancer Cell. .

Abstract

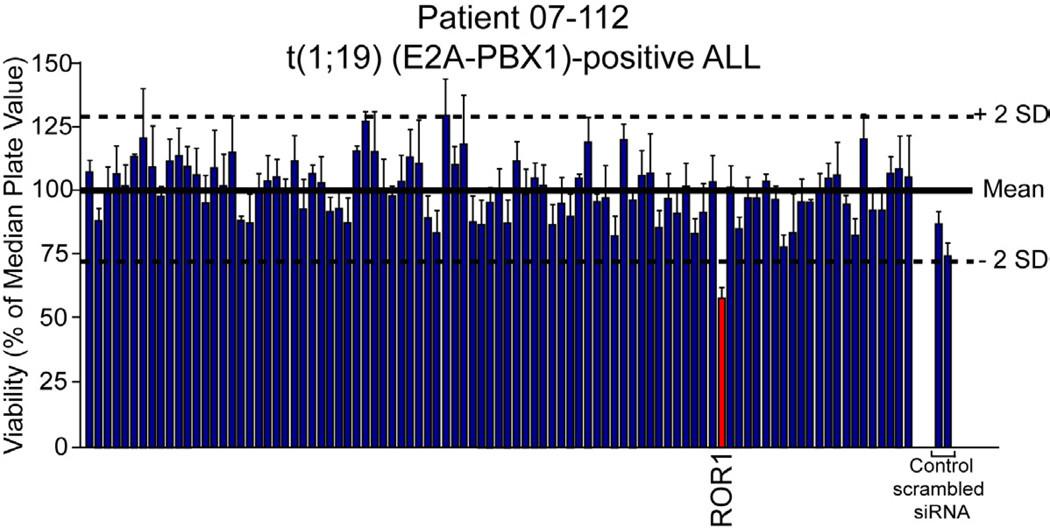
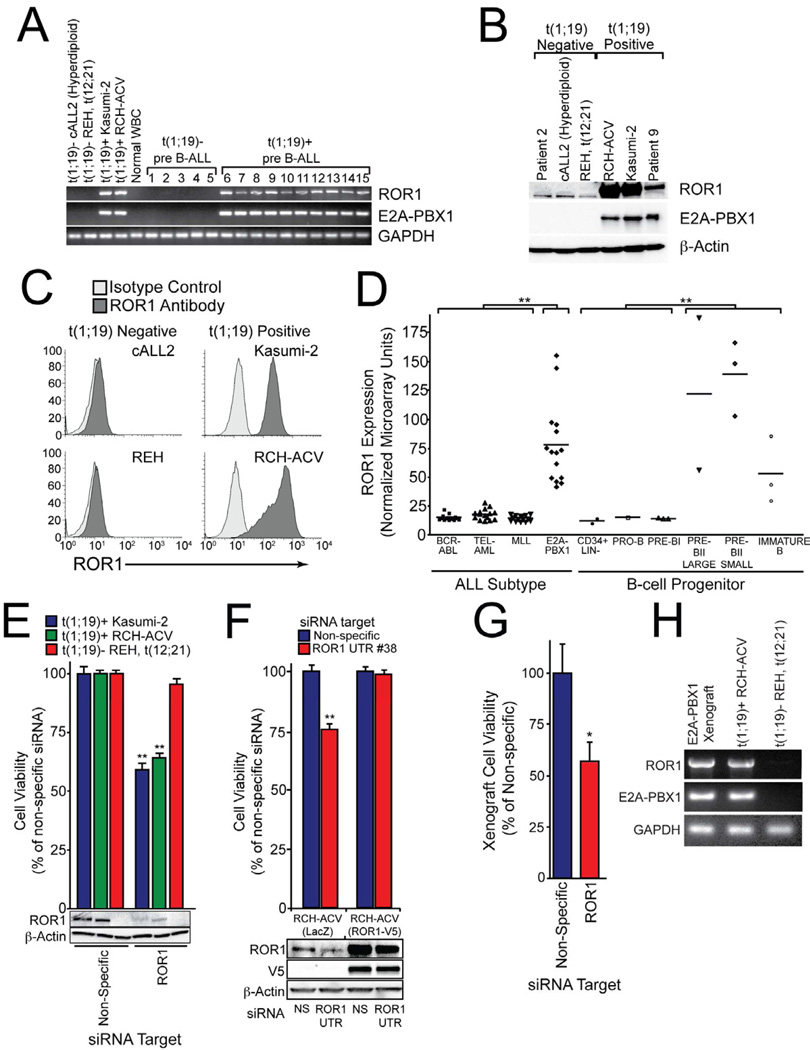
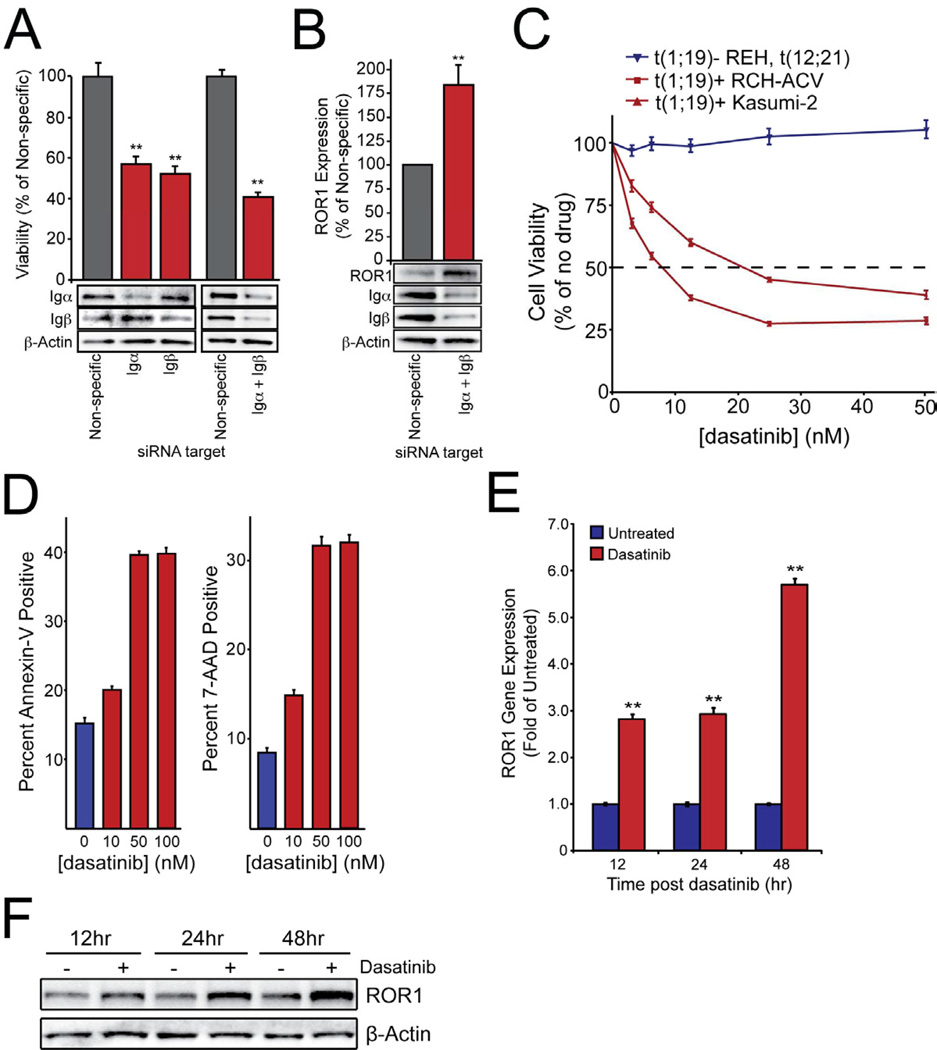
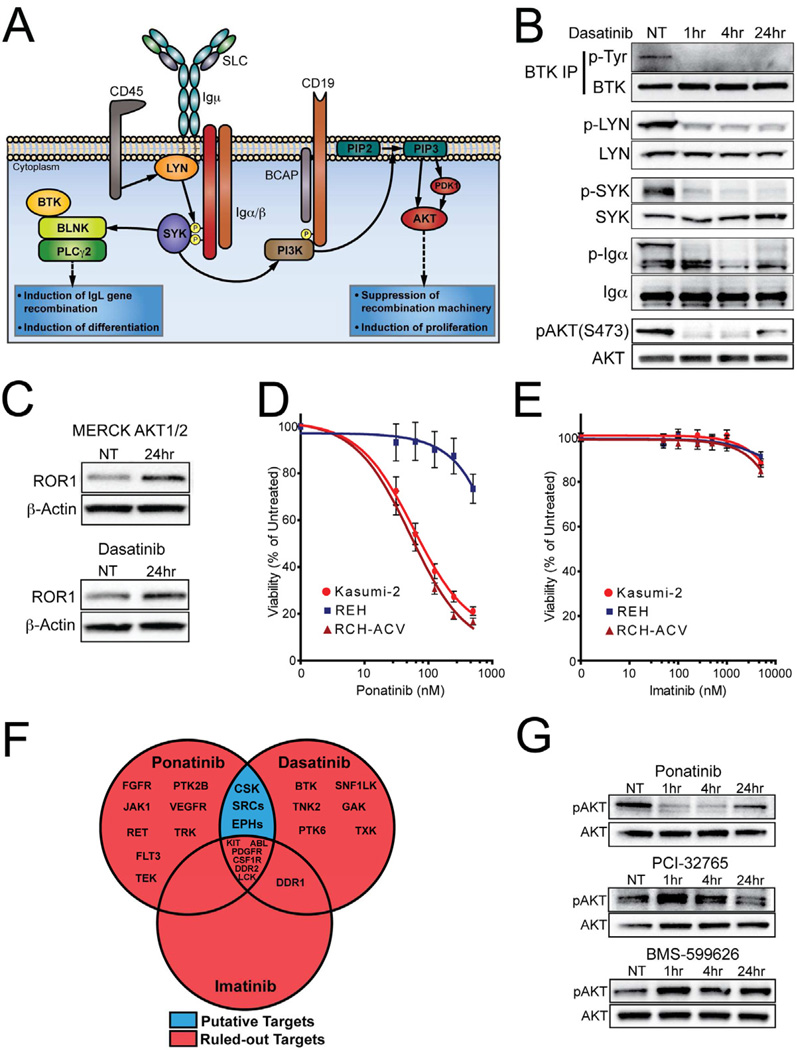
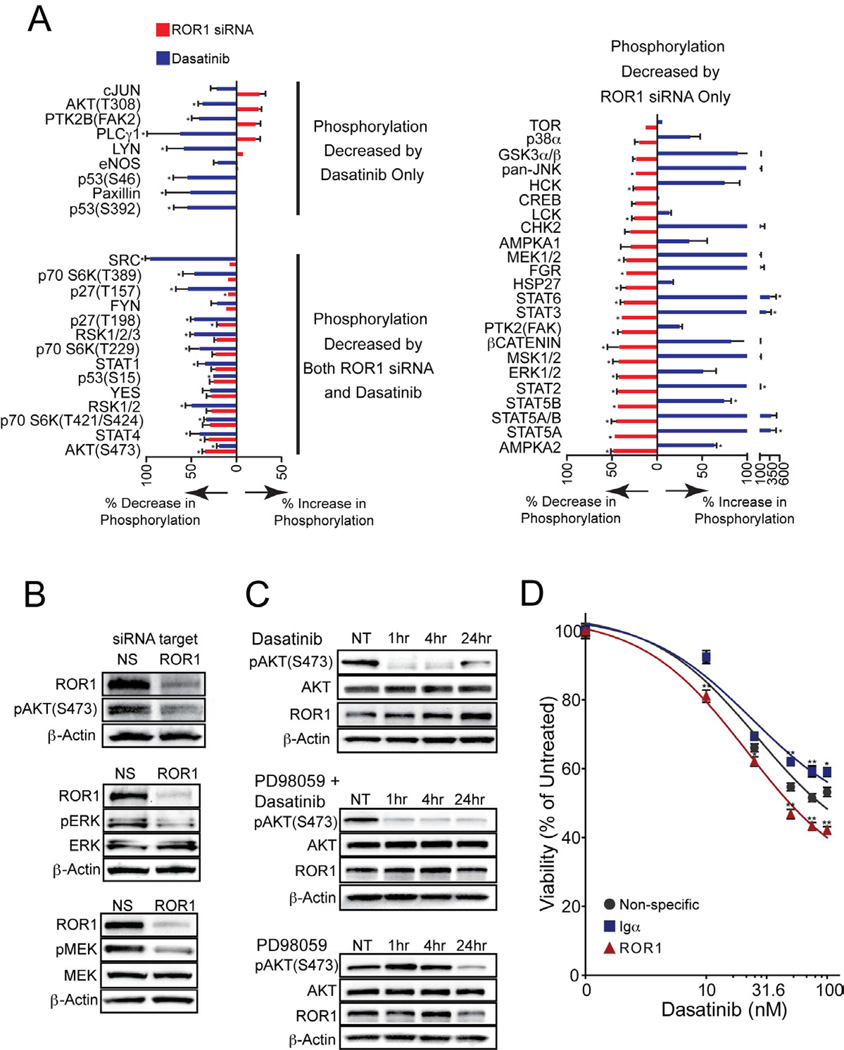
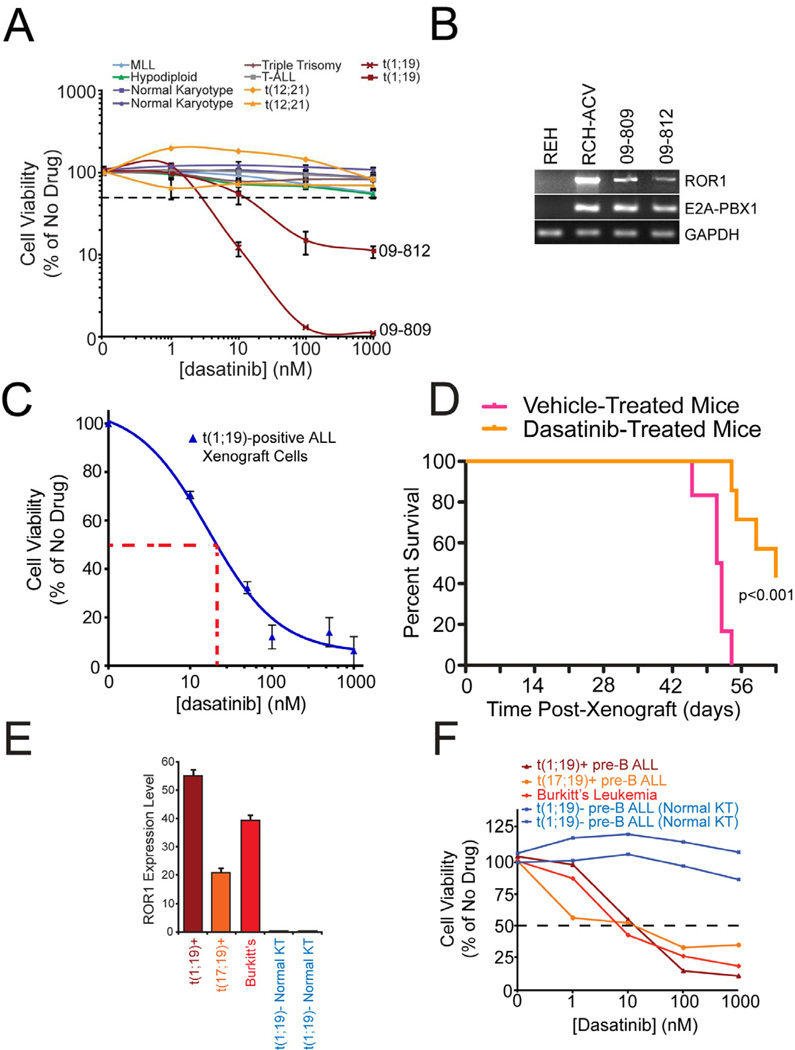
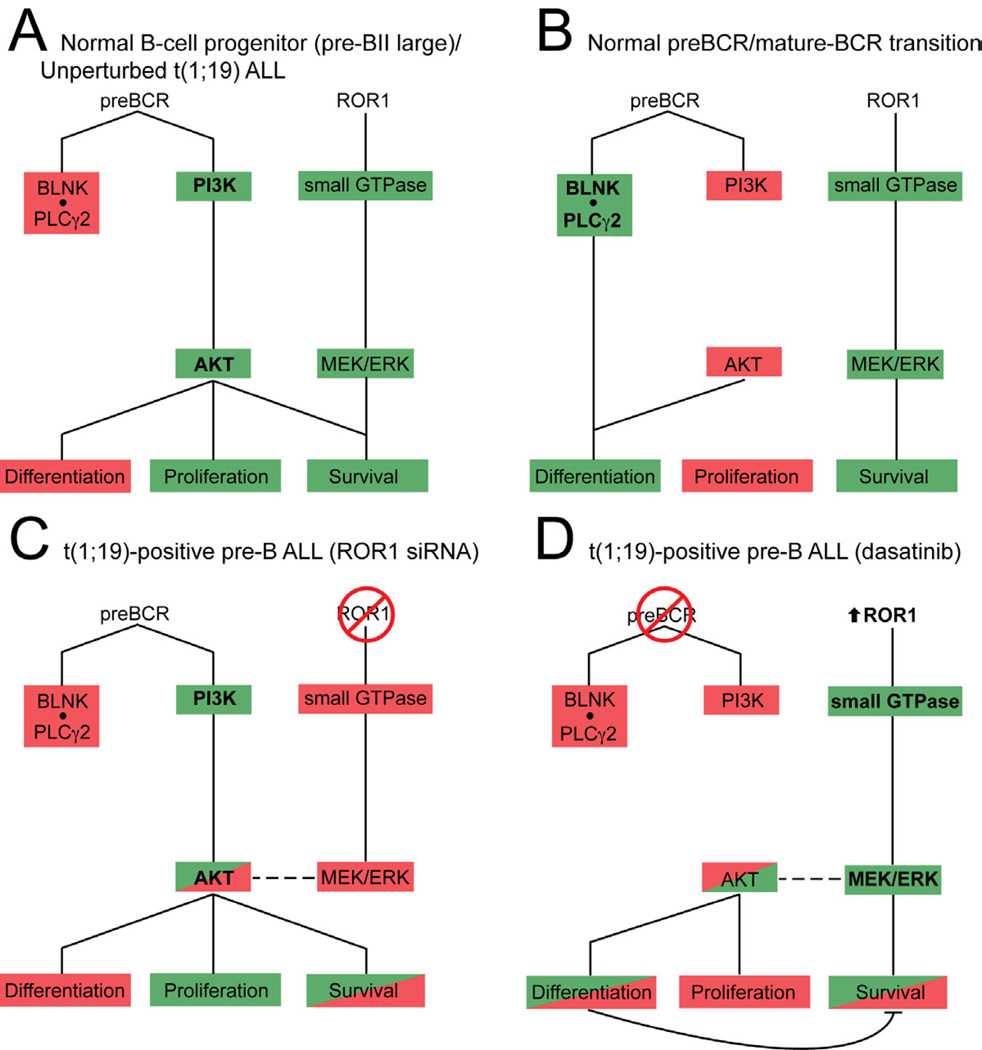
We report that t(1;19) ALL cells universally exhibit expression of and dependence on the cell surface receptor ROR1. We further identify t(1;19) ALL cell sensitivity to the kinase inhibitor dasatinib due to its inhibition of the pre-B cell receptor (pre-BCR) signaling complex. These phenotypes are a consequence of developmental arrest at an intermediate/late stage of B-lineage maturation. Additionally, inhibition of pre-BCR signaling induces further ROR1 upregulation, and we identify distinct ROR1 and pre-BCR downstream signaling pathways that are modulated in a counterbalancing manner-both leading to AKT phosphorylation. Consistent with this, AKT phosphorylation is transiently eliminated after dasatinib treatment, but is partially restored following dasatinib potentiation of ROR1 expression. Consequently, ROR1 silencing accentuates dasatinib killing of t(1;19) ALL cells.


Figures

Figure 1
Figure 1. ROR1 is a functional target in t(1;19) ALL
White Blood cells (2.25 × 10⁷) from a t(1;19)-positive ALL patient (07-112) were suspended in siPORT buffer and incubated with 1 µM siRNA from an siRNA library individually targeting each member of the tyrosine kinase family as well as N-RAS, K-RAS, and single and pooled non-specific siRNA controls. Cells were electroporated on a 96-well electroporation plate at 1110 V (equivalent of 150 V), 200 µsec, 2 pulses. Cells were replated into culture media and cell viability was determined by addition of a tetrazolium salt (MTS assay) at day 4 post-electroporation. Values represent percent mean (normalized to the median value on the plate) ± s.e.m (n = 3). See also Figure S1.
Figure 2
Figure 2. ROR1 is universally expressed and a therapeutic target in t(1;19) ALL
(A) cDNA derived from t(1;19)-positive and negative cell lines and primary patient samples was amplified using primers specific for ROR1, E2A-PBX1, or GAPDH and PCR products were analyzed by gel electrophoresis. (B) Whole cell extracts derived from t(1;19)-positive and negative cell lines and primary patient samples were subjected to immunoblot analysis using antibodies specific for ROR1, E2A-PBX1, or β-Actin. (C) Flow cytometric analysis of t(1;19)-positive and negative cell lines was performed using specific polyclonal anti-human ROR1 antibodies (dark grey histogram) versus isotype control (light grey histogram). (D) Gene expression microarray data for pediatric ALL patients and normal B-cell progenitor populations were compiled into a meta-analysis. Patients with MLL gene rearrangements, t(9;22) (BCR-ABL), t(12;21) (TEL-AML), or t(1;19) (E2A-PBX1) (n=15 for each subset) and non-malignant B-cell progenitor populations (CD34+ Lin−, pro-B, pre-B, pre-BII large, pre-BII small, and immature B) (n=15 total) were examined and Affymetrix intensity values for ROR1 are plotted for each individual patient sample. (**p <0.01) (E) RCH-ACV or Kasumi-2 cells (both t(1;19)-positive) as well as REH cells (t(12;21)-positive) were electroporated in the presence of non-specific or ROR1-targeting siRNA and plated into culture media. After 3 days, a sample of cells was harvested for immunoblot analysis using antibodies specific for ROR1 or β-Actin. After 4 days, cells were subjected to an MTS assay to measure cell viability. Values represent percent mean (normalized to non-specific control wells) ± s.e.m. (n = 10). (**p<0.01) (F) RCH-ACV cells stably expressing ROR1-V5 or LacZ control were electroporated in the presence of non-specific or ROR1 UTR-targeting siRNA and plated into culture media. After 3 days, a sample of cells was harvested for immunoblot analysis using antibodies specific for ROR1, V5, or β-Actin. After 4 days, cells were subjected to an MTS assay to measure cell viability. Values represent percent mean (normalized to non-specific control wells) ± s.e.m. (n = 6). (**p<0.01) (G) Primary cells from a t(1;19) ALL patient were propagated in NOD-SCID mice lacking the IL-2 receptor γ chain. Xenograft cells were harvested from bone marrow and spleen of overtly leukemic mice and electroporated with non-specific or ROR1-targeting siRNA. After 4 days, cells were subjected to an MTS assay to measure cell viability. Values represent percent mean (normalized to non-specific control wells) ± s.e.m. (n = 4). (*p<0.05) (H) Primary cells from a t(1;19) ALL patient were propagated in a xenograft mouse model as above and RNA was harvested from cell extracts. PCR was performed on cDNA with primers specific for ROR1, E2A-PBX1, or GAPDH. The t(1;19) positive (RCH-ACV) and negative (REH) cell lines were included for comparison. See also Figure S2.
Figure 3
Figure 3. Pre-BCR signaling inhibition impairs t(1;19) cell viability and activates ROR1 expression
(A) RCH-ACV cells were electroporated in the presence of non-specific siRNA or siRNA targeting Igα, Igβ, or both and then plated in culture media. After 3 days, a sample of cells was harvested for immunoblot analysis using antibodies specific for Igα, Igβ, or β-Actin. After 4 days, cells were subjected to an MTS assay to measure cell viability. Values represent percent mean (normalized to non-specific control wells) ± s.e.m. (n = 6). (**p<.01) (B) RCH-ACV cells were electroporated in the presence of non-specific or Igα and Igβ-targeting siRNA and then plated in culture media. After 3 days, cells were harvested for immunoblot analysis using antibodies specific for ROR1, Igα, Igβ, or β-Actin. One representative blot is included. Densitometry was performed to quantitate ROR1 expression. Values represent percent mean (normalized to non-specific control) ± s.e.m. (n = 3). (**p<.01) (C) RCH-ACV, Kasumi-2, and REH cells were cultured in graded concentrations of the kinase inhibitor dasatinib for 3 days at which time cells were subjected to an MTS assay for measurement of cell viability. Values represent percent mean (normalized to no-drug control wells) ± s.e.m. (n = 6). (D) RCH-ACV cells were cultured in graded concentrations of dasatinib for 96 hours before being stained with Annexin-V PE and 7-AAD and analyzed by flow cytometry to determine induction of apoptosis. Values represent the percentage of total positive cells ± s.e.m. (n = 3). (*p<.05, **p<.01). (E and F) RCH-ACV cells were cultured in the presence of 100nM dasatinib for 12, 24, and 48 hours. Cells were collected for RNA harvest and quantitative PCR analysis (E) or lysed for immunoblot analysis (F). PCR was performed on cDNA with primers specific for ROR1 and GAPDH to determine relative ROR1 mRNA expression levels. Values represent the fold change (normalized to untreated control cells) ± s.e.m. (n = 6). (**p<.01). Immunoblotting was performed with antibodies specific for ROR1 or β-Actin to determine relative ROR1 protein expression. See also Figure S3.
Figure 4
Figure 4. Dasatinib inhibits pre-BCR/SRC/AKT signaling and upregulates ROR1 in t(1;19) ALL
(A) Schematic of pre-BCR signaling and function during pre-B development. Adapted from (Herzog et al., 2009; Monroe, 2006) (B) RCH-ACV cells were treated with dasatinib (50 nM) over a time course and whole cell extracts were subjected to immunoblot analysis for total or phospho-LYN, SYK, Igα, and AKT. In addition, BTK was immunoprecipitated from the same cellular lysates and immunoprecipitates were immunoblotted for total or phospho-BTK. (C) RCH-ACV cells were treated with an allosteric inhibitor of AKT (1µM) or dasatinib (100nM) for 24 hours and whole cell extracts were subjected to immunoblot analysis for ROR1 and β-Actin. (D and E) RCH-ACV, Kasumi-2, and REH cells were cultured in graded concentrations of the kinase inhibitors ponatinib (D) or imatinib (E) for 3 days at which time cells were subjected to an MTS assay for measurement of cell viability. Values represent percent mean (normalized to no-drug control wells) ± s.e.m. (n = 6). (F) Venn-diagram identifies potential phenotype-mediated targets of dasatinib (CSK, SRC-family kinases, EPH receptors). Binding constants: dasatinib (<10nM), ponatinib (<25nM), imatinib (<500nM) (O’Hare et al, 2009; Karaman et al, 2008). (G) RCH-ACV cells were treated with ponatinib (50nM), PCI-32765 (50nM), or BMS-599626 (500nM) over a time course and whole cell extracts were subjected to immunoblot analysis for total or phospho-AKT. See also Figure S4.
Figure 5
Figure 5. Inhibition of pre-BCR or ROR1 result in counter-balancing effects on signaling
(A) RCH-ACV cells were treated with dasatinib for 24 hours or ROR1 siRNA for 72 hours and whole cell extracts were analyzed by phospho-proteomic array. Values on the graph represent percent phosphorylation change ± s.e.m. (n = 3) (*p<.05) of a total of 46 phospho-proteins for dasatinib relative to cells in the absence of any drug and for ROR1 siRNA relative to cells transfected with non-specific siRNA. (B) RCH-ACV cells were transfected with ROR1 or non-specific siRNA for 72 hours and whole cell extracts were subjected to immunoblot analysis for ROR1, phospho-AKT at residue Serine 473 and β-Actin; ROR1, total and phospho-ERK, and β-Actin; ROR1, total and phospho-MEK, and β-Actin for validation of ROR1 modulation observed by the phospho-proteomics screen in (A). (C) RCH-ACV cells were treated with dasatinib (50nM), PD98059 (50µM), or both over a time course and whole cell extracts were subjected to immunoblot analysis for total or phospho-AKT at residue Serine 473, ROR1, and β-Actin. (D) RCH-ACV cells were electroporated in the presence of non-specific, ROR1-targeting, or Igα-targeting siRNA and then plated in culture media. After 2 days, graded concentrations of dasatinib were added. Cells were allowed to culture an additional 2 days before they were subjected to an MTS assay for measurement of cell viability. Values represent percent mean (normalized to no-drug control wells) ± s.e.m. (n = 5). (*p<.05, **p<.01). See also Figure S6.
Figure 6
Figure 6. Clinical significance of dasatinib sensitivity in pre-BCR/BCR-positive malignancies
(A) Malignant cells from 10 pediatric ALL patients exhibiting a variety of chromosomal translocations (2 positive for t(1;19)) were cultured in graded concentrations of the kinase inhibitor, dasatinib, for 3 days at which time cells were subjected to an MTS assay for measurement of cell viability. Values represent percent mean (normalized to no-drug control wells) ± s.e.m. (n = 3). (B) cDNA derived from primary samples of t(1;19) ALL patients 09-809 and 09-812 was amplified using primers specific for ROR1, E2A-PBX1, or GAPDH. The t(1;19) positive (RCH-ACV) and negative (REH) cell lines were included for comparison. (C) Early passage t(1;19) ALL xenograft cells (ICN12) were cultured in graded concentrations of the kinase inhibitor dasatinib for 3 days at which time cells were subjected to an MTS assay for measurement of cell viability. Values represent percent mean (normalized to no-drug control wells) ± s.e.m. (n = 4). (D) Early passage t(1;19) ALL xenograft cells (ICN12) were injected intravenously into NOD/SCID mice. Mice were left untreated for 8 days to allow engraftment of cells and subdivided into two groups, one treated with dasatinib and the other with vehicle control. An initial dose-escalating round of treatment commenced with 10 mg/kg dasatinib for 6 days, followed by 50 mg/kg dasatinib for 4 days. Mice were untreated for the following 24 days, and this was followed by 12 additional days of dasatinib or vehicle treatment. Mouse survival was monitored over the course of the treatment. (E) cDNA derived from t(1;19) ALL, t(17;19) ALL, Burkitt’s lymphoma, and normal karyotype ALL primary samples was analyzed for relative ROR1 mRNA expression using quantitative PCR. cDNA was amplified using primers specific for ROR1 and GAPDH, and ROR1 levels were normalized to GAPDH. Values represent mean arbitrary quantitative PCR units ± s.e.m. (n = 3). (F) t(1;19) ALL, t(17;19) ALL, Burkitt’s lymphoma, and normal karyotype primary samples were cultured in the presence of graded concentrations of dasatinib. After 3 days, cells were subjected to an MTS assay for measurement of cell viability. Values represent percent mean, normalized to no-drug control wells. See also Figure S7.
Figure 7
Figure 7. Model for ROR1 supported B-cell development and crosstalk between ROR1 and the pre-BCR during therapeutic modulation of t(1;19) ALL
Schematic of ROR1 and pre-BCR signaling network and function during normal B-cell development and t(1;19)-positive pre-B ALL. Green indicates active signaling; red indicates inhibited signaling.

Similar articles

Cited by

References

    1. Baskar S, Kwong KY, Hofer T, Levy JM, Kennedy MG, Lee E, Staudt LM, Wilson WH, Wiestner A, Rader C. Unique cell surface expression of receptor tyrosine kinase ROR1 in human B-cell chronic lymphocytic leukemia. Clin Cancer Res. 2008;14:396–404. - PubMed
    1. Bhuin T, Roy JK. Rab11 regulates JNK and Raf/MAPK-ERK signalling pathways during Drosophila wing development. Cell Biol Int. 2010;34:1113–1118. - PubMed
    1. Bijl J, Sauvageau M, Thompson A, Sauvageau G. High incidence of proviral integrations in the Hoxa locus in a new model of E2a-PBX1-induced B-cell leukemia. Genes Dev. 2005;19:224–233. - PMC - PubMed
    1. Bilodeau MT, Balitza AE, Hoffman JM, Manley PJ, Barnett SF, Defeo-Jones D, Haskell K, Jones RE, Leander K, Robinson RG, et al. Allosteric inhibitors of Akt1 and Akt2: a naphthyridinone with efficacy in an A2780 tumor xenograft model. Bioorg Med Chem Lett. 2008;18:3178–3182. - PubMed
    1. Boulos N, Mulder HL, Calabrese CR, Morrison JB, Rehg JE, Relling MV, Sherr CJ, Williams RT. Chemotherapeutic agents circumvent emergence of dasatinib-resistant BCR-ABL kinase mutations in a precise mouse model of Philadelphia chromosome-positive acute lymphoblastic leukemia. Blood. 2011;117:3585–3595. - PMC - PubMed

Publication types

MeSH terms

LinkOut - more resources