Protein typing of circulating microvesicles allows real-time monitoring of glioblastoma therapy
- PMID: 23142818
- PMCID: PMC3518564
- DOI: 10.1038/nm.2994
Protein typing of circulating microvesicles allows real-time monitoring of glioblastoma therapy
Abstract
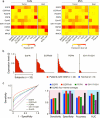
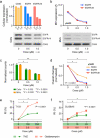
Glioblastomas shed large quantities of small, membrane-bound microvesicles into the circulation. Although these hold promise as potential biomarkers of therapeutic response, their identification and quantification remain challenging. Here, we describe a highly sensitive and rapid analytical technique for profiling circulating microvesicles directly from blood samples of patients with glioblastoma. Microvesicles, introduced onto a dedicated microfluidic chip, are labeled with target-specific magnetic nanoparticles and detected by a miniaturized nuclear magnetic resonance system. Compared with current methods, this integrated system has a much higher detection sensitivity and can differentiate glioblastoma multiforme (GBM) microvesicles from nontumor host cell-derived microvesicles. We also show that circulating GBM microvesicles can be used to analyze primary tumor mutations and as a predictive metric of treatment-induced changes. This platform could provide both an early indicator of drug efficacy and a potential molecular stratifier for human clinical trials.
Figures


Comment in
-
Nanotechnology opens up new realm of detection in GBM.Nat Rev Clin Oncol. 2013 Jan;10(1):4. doi: 10.1038/nrclinonc.2012.210. Epub 2012 Nov 27. Nat Rev Clin Oncol. 2013. PMID: 23183633 No abstract available.
-
Neuro-oncology: glioblastoma detection and therapy monitoring by microvesicle release.Nat Rev Neurol. 2013 Jan;9(1):4. doi: 10.1038/nrneurol.2012.247. Epub 2012 Dec 4. Nat Rev Neurol. 2013. PMID: 23208113 No abstract available.
-
Glioblastoma: Microvesicles as major biomarkers?Nat Rev Cancer. 2013 Jan;13(1):8. doi: 10.1038/nrc3424. Epub 2012 Dec 13. Nat Rev Cancer. 2013. PMID: 23235913 No abstract available.
Similar articles
-
Emerging circulating biomarkers in glioblastoma: promises and challenges.Expert Rev Mol Diagn. 2015;15(10):1311-23. doi: 10.1586/14737159.2015.1087315. Expert Rev Mol Diagn. 2015. PMID: 26394701 Review.
-
Magnetic Resonance Nano-Theranostics for Glioblastoma Multiforme.Curr Pharm Des. 2015;21(36):5256-66. doi: 10.2174/1381612821666150923103307. Curr Pharm Des. 2015. PMID: 26412354 Review.
-
Magnetic nanosensor for detection and profiling of erythrocyte-derived microvesicles.ACS Nano. 2013 Dec 23;7(12):11227-33. doi: 10.1021/nn405016y. Epub 2013 Dec 2. ACS Nano. 2013. PMID: 24295203 Free PMC article.
-
Glioblastoma microvesicles transport RNA and proteins that promote tumour growth and provide diagnostic biomarkers.Nat Cell Biol. 2008 Dec;10(12):1470-6. doi: 10.1038/ncb1800. Epub 2008 Nov 16. Nat Cell Biol. 2008. PMID: 19011622 Free PMC article.
-
Preoperative biomarkers of tumour vascularity are elevated in patients with glioblastoma multiforme.J Clin Neurosci. 2015 Nov;22(11):1802-8. doi: 10.1016/j.jocn.2015.06.013. Epub 2015 Aug 22. J Clin Neurosci. 2015. PMID: 26308396
Cited by
-
Nanotechnology opens up new realm of detection in GBM.Nat Rev Clin Oncol. 2013 Jan;10(1):4. doi: 10.1038/nrclinonc.2012.210. Epub 2012 Nov 27. Nat Rev Clin Oncol. 2013. PMID: 23183633 No abstract available.
-
Characterizing Extracellular Vesicles and Their Diverse RNA Contents.Front Genet. 2020 Jul 17;11:700. doi: 10.3389/fgene.2020.00700. eCollection 2020. Front Genet. 2020. PMID: 32765582 Free PMC article. Review.
-
High performance wash-free magnetic bioassays through microfluidically enhanced particle specificity.Sci Rep. 2015 Jun 30;5:11693. doi: 10.1038/srep11693. Sci Rep. 2015. PMID: 26123868 Free PMC article.
-
Rab27 GTPases distribute extracellular nanomaps for invasive growth and metastasis: implications for prognosis and treatment.Int J Mol Sci. 2013 May 10;14(5):9883-92. doi: 10.3390/ijms14059883. Int J Mol Sci. 2013. PMID: 23665896 Free PMC article. Review.
-
Acoustic purification of extracellular microvesicles.ACS Nano. 2015 Mar 24;9(3):2321-7. doi: 10.1021/nn506538f. Epub 2015 Feb 16. ACS Nano. 2015. PMID: 25672598 Free PMC article.
References
-
- Kulasingam V, Pavlou MP, Diamandis EP. Integrating high-throughput technologies in the quest for effective biomarkers for ovarian cancer. Nat Rev Cancer. 2010;10:371–378. - PubMed
-
- Simpson RJ, Lim JW, Moritz RL, Mathivanan S. Exosomes: proteomic insights and diagnostic potential. Expert Rev Proteomics. 2009;6:267–283. - PubMed
-
- Thery C, Ostrowski M, Segura E. Membrane vesicles as conveyors of immune responses. Nat Rev Immunol. 2009;9:581–593. - PubMed
Publication types
MeSH terms
Substances
Grants and funding
- U24 CA092782/CA/NCI NIH HHS/United States
- U54 CA151884/CA/NCI NIH HHS/United States
- P01 CA069246/CA/NCI NIH HHS/United States
- P50 CA086355/CA/NCI NIH HHS/United States
- U54CA151884/CA/NCI NIH HHS/United States
- U01CA141556/CA/NCI NIH HHS/United States
- U01 CA141556/CA/NCI NIH HHS/United States
- R01EB010011/EB/NIBIB NIH HHS/United States
- R21CA14122/CA/NCI NIH HHS/United States
- P50CA86355/CA/NCI NIH HHS/United States
- R01EB004626/EB/NIBIB NIH HHS/United States
- R01 EB010011/EB/NIBIB NIH HHS/United States
- U24CA092782/CA/NCI NIH HHS/United States
- R01 EB004626/EB/NIBIB NIH HHS/United States
- R01 HL113156/HL/NHLBI NIH HHS/United States
LinkOut - more resources
Full Text Sources
Other Literature Sources

