. 2012 Dec 28;287(53):44192-202.
doi: 10.1074/jbc.M112.422956. Epub 2012 Nov 8.

Identification of a tetrahydroquinoline analog as a pharmacological inhibitor of the cAMP-binding protein Epac

Affiliations

Identification of a tetrahydroquinoline analog as a pharmacological inhibitor of the cAMP-binding protein Epac

Delphine Courilleau et al. J Biol Chem. .

Abstract

The cAMP-binding protein Epac is a therapeutic target for the treatment of various diseases such as cardiac hypertrophy and tumor invasion. This points out the importance to develop Epac inhibitors to better understand the involvement of these cAMP sensors in physiology and pathophysiology. Here, we have developed a functional fluorescence-based high-throughput assay with a Z' value around 0.7 for screening Epac-specific antagonists. We identified an Epac1 inhibitor compound named CE3F4 that blocked Epac1 guanine nucleotide exchange activity toward its effector Rap1 both in cell-free systems and in intact cells. CE3F4 is a tetrahydroquinoline analog that fails to influence protein kinase A holoenzyme activity. CE3F4 inhibited neither the interaction of Rap1 with Epac1 nor directly the GDP exchange on Rap1. The kinetics of inhibition by CE3F4 indicated that this compound did not compete for binding of agonists to Epac1 and suggested an uncompetitive inhibition mechanism with respect to Epac1 agonists. A structure-activity study showed that the formyl group on position 1 and the bromine atom on position 5 of the tetrahydroquinoline skeleton were important for CE3F4 to exert its inhibitory activity. Finally, CE3F4 inhibited Rap1 activation in living cultured cells, following Epac activation by either 8-(4-chlorophenylthio)-2'-O-methyl-cAMP, an Epac-selective agonist, or isoprenaline, a non-selective β-adrenergic receptor agonist. Our study shows that CE3F4 and related compounds may serve as a basis for the development of new therapeutic drugs.


Figures

FIGURE 1.
FIGURE 1.
Kinetic characterization of GDP exchange catalyzed by the wild-type form of Epac1 and Epac1-catalytic domain (Epac1-Cat). The relative fluorescence units (RFU) were monitored in real time as described under “Experimental Procedures.” Release of bGDP from 200 nm preloaded Rap1 was assayed at 22 °C in triplicate wells of 384-well plates in the presence of 20 μm unlabeled GDP. A, the exchange activity of 100 nm Epac1 (mean ± S.E.; error bars are masked by the symbols) was measured after injection of 007 (■ and ●) or buffer (□ and ○) in the presence of GST-Rap1 (■ and □) or cleaved Rap1 (● and ○). The curves and first-order rate constants were obtained by fitting single exponentials to the data. B, the exchange activity of 100 nm Epac1 was measured in the absence (▵, □, and ○) or presence (■ and ●) of 50 μm 009, a cGMP analog. The exchange activity (mean ± S.E.; error bars are masked by the symbols) of 100 nm Epac1 (■ and □) was measured following injection of 2 μm 007 and preloaded Rap1, and that of 100 nm Epac1-Cat (● and ○) was measured following injection of preloaded Rap1. Release of bGDP from Rap1 was also measured in the absence of Epac1 and Epac1-Cat (▵). C and D, initial velocities of GDP exchange on 200 nm preloaded Rap1 were measured in triplicate in the presence of 100 nm Epac1 by fitting the RFU data to single exponentials with Graphpad Prism. Exchange was induced by increasing concentrations of the agonist 007 (C), or a fixed concentration of 007 (2 μm) and increasing concentrations of the in vitro antagonist 009 (D). Initial velocities (mean ± S.E.; some error bars are masked by the symbols) were plotted against the concentration of each effector on a log scale. The EC50 of 007 and IC50 of 009 were calculated by fitting the data with Graphpad Prism.
FIGURE 2.
FIGURE 2.
Identification of CE3F4 as an EPAC1 antagonist by HTS screening. A, scatter plot of the percentage inhibition of each well from 640 compounds of the CE library tested at 6.67 μg/ml. The exchange activity was induced by 2 μm 007, and the percentage inhibition was calculated on the basis of the maximum inhibition promoted by 50 μm 009 (n = 32) and minimum inhibition measured in the absence of 009 (n = 32). One compound, CE3F4 (●), yielded both > 100% inhibition of the exchange activity and approximately 10 standard deviations (10×SD, dashed line) above the mean of the population of compounds. B, chemical structure of CE3F4. Numbering of the positions in CE3F4 formula corresponds to that of the tetrahydroquinoline skeleton.
FIGURE 3.
FIGURE 3.
Characterization of CE3F4-mediated inhibition of 007-induced Epac1 activity and of constitutive Epac1-Cat activity. Variations of relative fluorescence units (RFU) were studied as a function of time and fitted to single exponentials. Reported values are mean ± S.E. (n = 3; some error bars are masked by the symbols). A, Epac1 nucleotide exchange activity was measured in the absence of 007 (■) or in the presence of 2 μm 007, either alone (●) or with 25 μm 009 (▿) or with 20 μm CE3F4 (○). B, Epac1-Cat exchange activity was measured in the absence of inhibitor (●) or in the presence of 25 μm 009 (▿) or 20 μm CE3F4 (○). Fluorescence was also recorded in the absence of Epac1-Cat (■). C, initial velocities of nucleotide exchange induced by Epac1 together with 2 μm 007 (○) or by Epac1-Cat (■) were measured in the presence of increasing concentrations of CE3F4. The IC50 was calculated using Graphpad Prism.
FIGURE 4.
FIGURE 4.
Kinetics of inhibition of Epac1 exchange activity by CE3F4. Initial velocities of GDP exchange were measured in triplicate from time course studies and are shown as mean ± S.E. (some error bars are masked by the symbols). A, Epac1 was activated by either 2 μm or 20 μm 007, and the exchange activity was measured without inhibitor (black bars), with 25 μm 009 (hatched bars), or with 20 μm CE3F4 (empty bars). B, initial velocities of nucleotide exchange induced by Epac1 were measured in triplicate in the presence of 2 μm (●) or 20 μm (○) 007 together with increasing concentrations of CE3F4. The IC50s were calculated using Graphpad Prism. C, initial velocities of nucleotide exchange were measured in the presence of increasing concentrations of 007 and either in the absence (●) or presence of 20 μm (□) or 50 μm (♢) CE3F4. The EC50s and maximum velocities of exchange (Vmax) were calculated using Graphpad Prism.
FIGURE 5.
FIGURE 5.
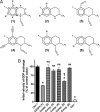
Chemical specificity of CE3F4 analogs for Epac1 inhibition. A, structures of the Epac1 antagonist CE3F4 and of its analogs or derivatives. CE3F4 (compound 1) is an antagonist of 007-induced Epac1 activation identified by high throughput screening, whereas compounds 2–6 are analogs or derivatives tested for their potential antagonistic properties. B, the initial velocity of Epac1-catalyzed GDP exchange was measured in the absence (Ctrl-) or presence (Ctrl+) of 20 μm 007, and the latter value was set at 100% exchange activity. CE3F4 and compounds 2–6 were added just before the agonist 007, and the resulting exchange activity was expressed as the percentage of that measured under the Ctrl+ condition. Values are mean ± S.E. (n = 3). Student's t tests: *, p < 1% versus Ctrl+; ns, p > 5% versus Ctrl+; ¶, p < 1% versus CE3F4.
FIGURE 6.
FIGURE 6.
Effect of Epac1 antagonists on Epac1-BRET sensor activation by 007 and cAMP. HEK293 cells, transfected with the pcDNA3-EPS expression vector, were lysed, and the soluble fraction was used for BRET measurements. 0.4 μl of cell extract was mixed with the compounds under study in a well of a 384-well plate. Coelenterazine-h (2 μm final concentration) was injected into the well, and the emission signals from Renilla luciferase and citrine-cp were recorded as a function of time before and after injection of a solution of Epac1 agonist (007 or cAMP). The BRET ratio (mean ± S.E. from 3 wells; some error bars are masked by the symbols) was calculated as the ratio of the citrine-cp emission signal to that of Renilla luciferase. A, at the time indicated by the arrow, a 007 solution (10 μm final concentration (○) or vehicle (●) were injected into the well, and the BRET ratios were recorded for an additional period of time. B, the BRET readings (mean ± S.E., n = 3) were obtained 10–12 min after injection of increasing concentrations of 007 (○) or cAMP (●). The variation in the BRET ratio is plotted against the concentration of 007 on a log scale. C, 50 μm 009, 40 μm CE3F4, 40 μm compound 2, or vehicle (No Inh.) were added to the cell extract before injection of 007 (10 μm) or cAMP (100 μm), and BRET ratios (mean ± S.E., n = 3) were measured as in B and plotted as percent variations in BRET ratios relative to each no-inhibitor control value. *, p < 1% versus control value without 007; ¶, *, p < 1% versus control value without cAMP.
FIGURE 7.
FIGURE 7.
CE3F4 does not influence PKA activity. A and C, time course decrease of NADH at 340 nm in the presence of type I and II PKA holoenzymes and the indicated compounds. H89 is a pharmacological inhibitor of PKA and was used as a positive control in the experiments. Similar results were obtained from four independent experiments. n.s., not significant. B and D, relative type I and type II PKA holoenzymes activity. The bar graph represents the mean ± S.E. of four independent experiments. ***, p < 0.001 versus indicated control condition, one-way analysis of variance, Bonferroni comparison test. Results are expressed as the percentage of control (Ctl).
FIGURE 8.
FIGURE 8.
CE3F4 inhibits Epac-induced Rap1 activation in living cultured cells. HEK293 cells (A and B) and rat neonatal cardiac myocytes (C) were transfected with Epac1 expression vector. HEK293 cells were also transfected with pcDNA3 control vector. 24 h after transfection, cells were preincubated or not preincubated with CE3F4 for 30 min and were then treated or not treated with Sp-007 (10 μm) for 10 min. D, HEK293 cells overexpressing β1AR and transfected with Epac1 were pretreated or not pretreated with CE3F4 as in B and stimulated or not stimulated with Iso (10 μm) for 10 min. Amounts of Rap1-GTP were determined by pull-down assays. A control for total Rap expression is shown. Expression of Epac1 was measured in cell lysates. The bar graph represents the mean ± S.E. of five (A and B) or three (C and D) independent experiments. ***, p < 0.001; **, p < 0.01; *, p < 0.05 between indicated conditions, paired two-tailed Student's t test. Results are expressed as the percentage of unstimulated control cells.

Similar articles

Cited by

References

    1. Breckler M., Berthouze M., Laurent A. C., Crozatier B., Morel E., Lezoualc'h F. (2011) Rap-linked cAMP signaling Epac proteins. Compartmentation, functioning and disease implications. Cell. Signal. 23, 1257–1266 - PubMed
    1. Métrich M., Berthouze M., Morel E., Crozatier B., Gomez A. M., Lezoualc'h F. (2010) Role of the cAMP-binding protein Epac in cardiovascular physiology and pathophysiology. Pflugers Arch. 459, 535–546 - PubMed
    1. Kawasaki H., Springett G. M., Mochizuki N., Toki S., Nakaya M., Matsuda M., Housman D. E., Graybiel A. M. (1998) A family of cAMP-binding proteins that directly activate Rap1. Science 282, 2275–2279 - PubMed
    1. de Rooij J., Zwartkruis F. J., Verheijen M. H., Cool R. H., Nijman S. M., Wittinghofer A., Bos J. L. (1998) Epac is a Rap1 guanine-nucleotide-exchange factor directly activated by cyclic AMP. Nature 396, 474–477 - PubMed
    1. Gloerich M., Bos J. L. (2010) Epac. Defining a new mechanism for cAMP action. Annu. Rev. Pharmacol. Toxicol. 50, 355–375 - PubMed

Publication types

MeSH terms

LinkOut - more resources