Long range effect of mutations on specific conformational changes in the extracellular loop 2 of angiotensin II type 1 receptor
- PMID: 23139413
- PMCID: PMC3537051
- DOI: 10.1074/jbc.M112.392514
Long range effect of mutations on specific conformational changes in the extracellular loop 2 of angiotensin II type 1 receptor
Abstract
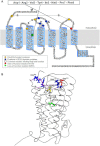
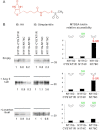
The topology of the second extracellular loop (ECL2) and its interaction with ligands is unique in each G protein-coupled receptor. When the orthosteric ligand pocket located in the transmembrane (TM) domain is occupied, ligand-specific conformational changes occur in the ECL2. In more than 90% of G protein-coupled receptors, ECL2 is tethered to the third TM helix via a disulfide bond. Therefore, understanding the extent to which the TM domain and ECL2 conformations are coupled is useful. To investigate this, we examined conformational changes in ECL2 of the angiotensin II type 1 receptor (AT1R) by introducing mutations in distant sites that alter the activation state equilibrium of the AT1R. Differential accessibility of reporter cysteines introduced at four conformation-sensitive sites in ECL2 of these mutants was measured. Binding of the agonist angiotensin II (AngII) and inverse agonist losartan in wild-type AT1R changed the accessibility of reporter cysteines, and the pattern was consistent with ligand-specific "lid" conformations of ECL2. Without agonist stimulation, the ECL2 in the gain of function mutant N111G assumed a lid conformation similar to AngII-bound wild-type AT1R. In the presence of inverse agonists, the conformation of ECL2 in the N111G mutant was similar to the inactive state of wild-type AT1R. In contrast, AngII did not induce a lid conformation in ECL2 in the loss of function D281A mutant, which is consistent with the reduced AngII binding affinity in this mutant. However, a lid conformation was induced by [Sar(1),Gln(2),Ile(8)] AngII, a specific analog that binds to the D281A mutant with better affinity than AngII. These results provide evidence for the emerging paradigm of domain coupling facilitated by long range interactions at distant sites on the same receptor.
Figures


Similar articles
-
Ligand-specific conformation of extracellular loop-2 in the angiotensin II type 1 receptor.J Biol Chem. 2010 May 21;285(21):16341-50. doi: 10.1074/jbc.M109.094870. Epub 2010 Mar 18. J Biol Chem. 2010. PMID: 20299456 Free PMC article.
-
Role of the transmembrane domain 4/extracellular loop 2 junction of the human gonadotropin-releasing hormone receptor in ligand binding and receptor conformational selection.J Biol Chem. 2011 Oct 7;286(40):34617-26. doi: 10.1074/jbc.M111.240341. Epub 2011 Aug 10. J Biol Chem. 2011. PMID: 21832286 Free PMC article.
-
The second transmembrane domain of the human type 1 angiotensin II receptor participates in the formation of the ligand binding pocket and undergoes integral pivoting movement during the process of receptor activation.J Biol Chem. 2009 May 1;284(18):11922-9. doi: 10.1074/jbc.M808113200. Epub 2009 Mar 9. J Biol Chem. 2009. PMID: 19276075 Free PMC article.
-
Understanding the common themes and diverse roles of the second extracellular loop (ECL2) of the GPCR super-family.Mol Cell Endocrinol. 2017 Jul 5;449:3-11. doi: 10.1016/j.mce.2016.11.023. Epub 2016 Nov 27. Mol Cell Endocrinol. 2017. PMID: 27899324 Review.
-
Current topics in angiotensin II type 1 receptor research: Focus on inverse agonism, receptor dimerization and biased agonism.Pharmacol Res. 2017 Sep;123:40-50. doi: 10.1016/j.phrs.2017.06.013. Epub 2017 Jun 23. Pharmacol Res. 2017. PMID: 28648738 Free PMC article. Review.
Cited by
-
Identification of the GPR55 antagonist binding site using a novel set of high-potency GPR55 selective ligands.Biochemistry. 2013 Dec 31;52(52):9456-69. doi: 10.1021/bi4008885. Epub 2013 Dec 17. Biochemistry. 2013. PMID: 24274581 Free PMC article.
-
Reassessment of the unique mode of binding between angiotensin II type 1 receptor and their blockers.PLoS One. 2013 Nov 8;8(11):e79914. doi: 10.1371/journal.pone.0079914. eCollection 2013. PLoS One. 2013. PMID: 24260317 Free PMC article.
-
Angiotensin and Endothelin Receptor Structures With Implications for Signaling Regulation and Pharmacological Targeting.Front Endocrinol (Lausanne). 2022 Apr 19;13:880002. doi: 10.3389/fendo.2022.880002. eCollection 2022. Front Endocrinol (Lausanne). 2022. PMID: 35518926 Free PMC article. Review.
-
Luminal ANG II is internalized as a complex with AT1R/AT2R heterodimers to target endoplasmic reticulum in LLC-PK1 cells.Am J Physiol Renal Physiol. 2017 Aug 1;313(2):F440-F449. doi: 10.1152/ajprenal.00261.2016. Epub 2017 May 3. Am J Physiol Renal Physiol. 2017. PMID: 28468964 Free PMC article.
-
The importance of non-HLA antibodies in transplantation.Nat Rev Nephrol. 2016 Aug;12(8):484-95. doi: 10.1038/nrneph.2016.88. Epub 2016 Jun 27. Nat Rev Nephrol. 2016. PMID: 27345243 Free PMC article. Review.
References
-
- Lagerström M. C., Schiöth H. B. (2008) Structural diversity of G protein-coupled receptors and significance for drug discovery. Nat. Rev. Drug Discov. 7, 339–357 - PubMed
-
- Vaidehi N., Kenakin T. (2010) The role of conformational ensembles of seven transmembrane receptors in functional selectivity. Curr. Opin. Pharmacol. 10, 775–781 - PubMed
Publication types
MeSH terms
Substances
Grants and funding
LinkOut - more resources
Full Text Sources
Other Literature Sources
Molecular Biology Databases
Miscellaneous

