

ROS production as a common mechanism of ENaC regulation by EGF, insulin, and IGF-1
- PMID: 23135700
- PMCID: PMC3543576
- DOI: 10.1152/ajpcell.00231.2012
ROS production as a common mechanism of ENaC regulation by EGF, insulin, and IGF-1
Abstract
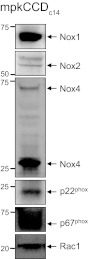
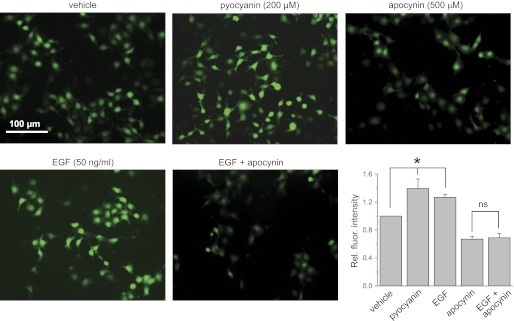
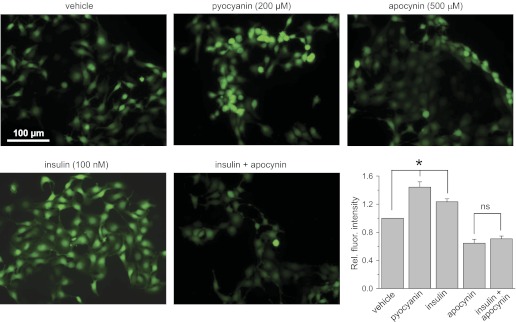
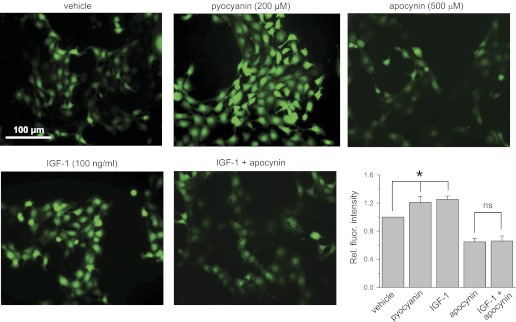
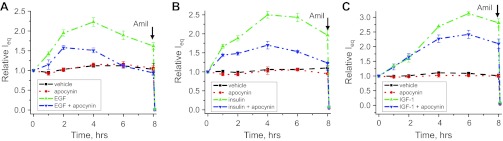
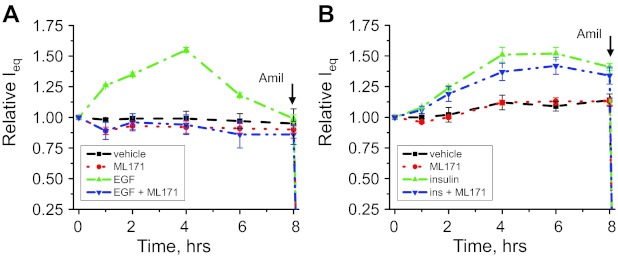
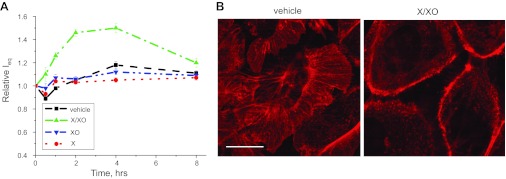
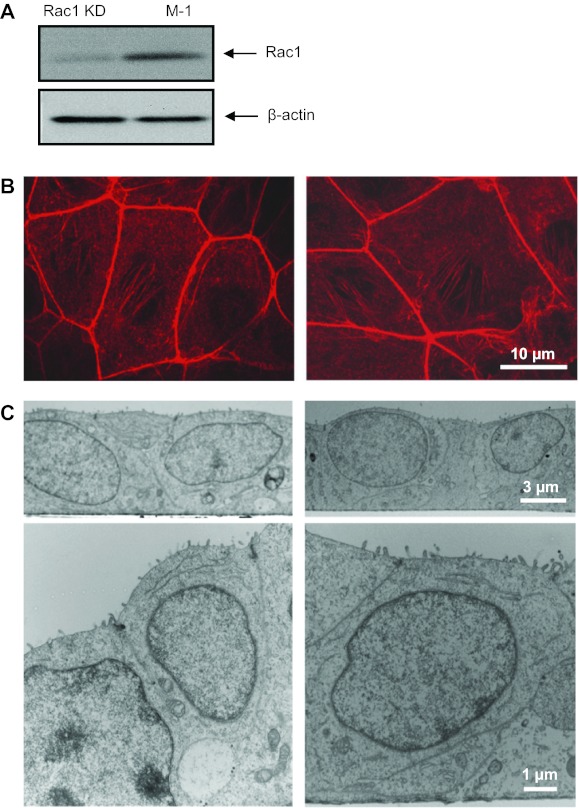
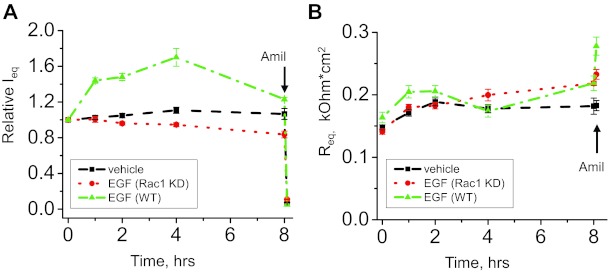
The epithelial Na(+) channel (ENaC) is a key transporter participating in the fine tuning of Na(+) reabsorption in the nephron. ENaC activity is acutely upregulated by epidermal growth factor (EGF), insulin, and insulin-like growth factor-1 (IGF-1). It was also proposed that reactive oxygen species (ROS) have a stimulatory effect on ENaC. Here we studied whether effects of EGF, insulin, and IGF-1 correlate with ROS production in the mouse cortical collecting duct (mpkCCD(c14)) cells. Western blotting confirmed the expression of the NADPH oxidase complex subunits in these cells. Treatment of mpkCCD(c14) cells with EGF, insulin, or IGF-1 evoked an increase in ROS production as measured by CM-H(2)DCF-DA fluorescence. ROS production caused by a xanthine-xanthine oxidase reaction also resulted in a significant elevation in short-circuit current through the mpkCCD(c14) monolayer. Transepithelial current measurements showed an acute increase of amiloride-sensitive current through the mpkCCD(c14) monolayer in response to EGF, insulin, or IGF-1. Pretreatment with the nonselective NADPH oxidase activity inhibitor apocynin blunted both ROS production and increase in ENaC-mediated current in response to these drugs. To further test whether NADPH oxidase subunits are involved in the effect of EGF, we used a stable M-1 cell line with a knockdown of Rac1, which is one of the key subunits of the NADPH oxidase complex, and measured amiloride-sensitive currents in response to EGF. In contrast to control cells, EGF had no effect in Rac1 knockdown cells. We hypothesize that EGF, insulin, and IGF-1 have a common stimulatory effect on ENaC mediated by ROS production.
Figures
Similar articles
-
Role of Rho GDP dissociation inhibitor α in control of epithelial sodium channel (ENaC)-mediated sodium reabsorption.J Biol Chem. 2014 Oct 10;289(41):28651-9. doi: 10.1074/jbc.M114.558262. Epub 2014 Aug 27. J Biol Chem. 2014. PMID: 25164814 Free PMC article.
-
EGF and its related growth factors mediate sodium transport in mpkCCDc14 cells via ErbB2 (neu/HER-2) receptor.J Cell Physiol. 2010 Apr;223(1):252-9. doi: 10.1002/jcp.22033. J Cell Physiol. 2010. PMID: 20049896
-
Acute regulation of the epithelial Na+ channel by phosphatidylinositide 3-OH kinase signaling in native collecting duct principal cells.J Am Soc Nephrol. 2007 Jun;18(6):1652-61. doi: 10.1681/ASN.2007010020. Epub 2007 Apr 18. J Am Soc Nephrol. 2007. PMID: 17442787
-
Novel role of Rac1/WAVE signaling mechanism in regulation of the epithelial Na+ channel.Hypertension. 2011 May;57(5):996-1002. doi: 10.1161/HYPERTENSIONAHA.110.157784. Epub 2011 Apr 4. Hypertension. 2011. PMID: 21464391
-
Regulated sodium transport in the renal connecting tubule (CNT) via the epithelial sodium channel (ENaC).Pflugers Arch. 2009 May;458(1):111-35. doi: 10.1007/s00424-009-0656-0. Epub 2009 Mar 11. Pflugers Arch. 2009. PMID: 19277701 Review.
Cited by
-
Mineralocorticoid receptors in the pathogenesis of insulin resistance and related disorders: from basic studies to clinical disease.Am J Physiol Regul Integr Comp Physiol. 2021 Mar 1;320(3):R276-R286. doi: 10.1152/ajpregu.00280.2020. Epub 2021 Jan 13. Am J Physiol Regul Integr Comp Physiol. 2021. PMID: 33438511 Free PMC article. Review.
-
Role of submembranous actin cytoskeleton in regulation of non-voltage-gated sodium channels.Dokl Biochem Biophys. 2013 May-Jun;450:126-9. doi: 10.1134/S1607672913030010. Epub 2013 Jul 4. Dokl Biochem Biophys. 2013. PMID: 23824452 No abstract available.
-
Paracrine stimulation of perinatal lung functional and structural maturation by mesenchymal stem cells.Stem Cell Res Ther. 2020 Dec 9;11(1):525. doi: 10.1186/s13287-020-02028-4. Stem Cell Res Ther. 2020. PMID: 33298180 Free PMC article.
-
Cross-talk between insulin and IGF-1 receptors in the cortical collecting duct principal cells: implication for ENaC-mediated Na+ reabsorption.Am J Physiol Renal Physiol. 2015 Apr 1;308(7):F713-9. doi: 10.1152/ajprenal.00081.2014. Epub 2015 Jan 28. Am J Physiol Renal Physiol. 2015. PMID: 25651558 Free PMC article.
-
A proton-inhibited DEG/ENaC ion channel maintains neuronal ionstasis and promotes neuronal survival under stress.iScience. 2023 Jun 14;26(7):107117. doi: 10.1016/j.isci.2023.107117. eCollection 2023 Jul 21. iScience. 2023. PMID: 37416472 Free PMC article.
References
-
- Abe M, O'Connor P, Kaldunski M, Liang M, Roman RJ, Cowley AW., Jr Effect of sodium delivery on superoxide and nitric oxide in the medullary thick ascending limb. Am J Physiol Renal Physiol 291: F350–F357, 2006 - PubMed
-
- Ashkroft FM. Ion channels and disease. San Diego, CA: Academic, 2000, p. 1–502
-
- Bae YS, Kang SW, Seo MS, Baines IC, Tekle E, Chock PB, Rhee SG. Epidermal growth factor (EGF)-induced generation of hydrogen peroxide. Role in EGF receptor-mediated tyrosine phosphorylation. J Biol Chem 272: 217–221, 1997 - PubMed
-
- Bao HF, Song JZ, Duke BJ, Ma HP, Denson DD, Eaton DC. Ethanol stimulates epithelial sodium channels by elevating reactive oxygen species. Am J Physiol Cell Physiol. First published August 15, 2012; doi:10.1152/ajpcell.00139.2012 - DOI - PMC - PubMed
-
- Bens M, Vallet V, Cluzeaud F, Pascual-Letallec L, Kahn A, Rafestin-Oblin ME, Rossier BC, Vandewalle A. Corticosteroid-dependent sodium transport in a novel immortalized mouse collecting duct principal cell line. J Am Soc Nephrol 10: 923–934, 1999 - PubMed
Publication types
MeSH terms
Substances
Grants and funding
LinkOut - more resources
Full Text Sources
Other Literature Sources
Medical
Research Materials
Miscellaneous