

Tubular crystals and helical arrays: structural determination of HIV-1 capsid assemblies using iterative helical real-space reconstruction
- PMID: 23132072
- PMCID: PMC3748364
- DOI: 10.1007/978-1-62703-176-9_21
Tubular crystals and helical arrays: structural determination of HIV-1 capsid assemblies using iterative helical real-space reconstruction
Abstract
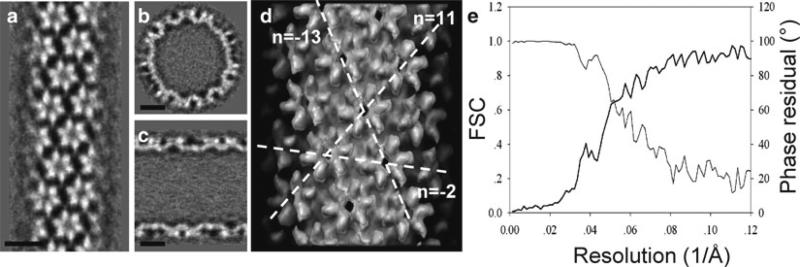
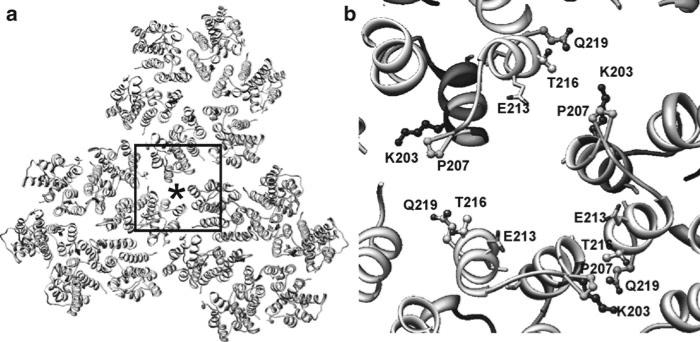
Helical structures are important in many different life forms and are well-suited for structural studies by cryo-EM. A unique feature of helical objects is that a single projection image contains all the views needed to perform a three-dimensional (3D) crystallographic reconstruction. Here, we use HIV-1 capsid assemblies to illustrate the detailed approaches to obtain 3D density maps from helical objects. Mature HIV-1 particles contain a conical- or tubular-shaped capsid that encloses the viral RNA genome and performs essential functions in the virus life cycle. The capsid is composed of capsid protein (CA) oligomers which are helically arranged on the surface. The N-terminal domain (NTD) of CA is connected to its C-terminal domain (CTD) through a flexible hinge. Structural analysis of two- and three-dimensional crystals provided molecular models of the capsid protein (CA) and its oligomer forms. We determined the 3D density map of helically assembled HIV-1 CA hexamers at 16 Å resolution using an iterative helical real-space reconstruction method. Docking of atomic models of CA-NTD and CA-CTD dimer into the electron density map indicated that the CTD dimer interface is retained in the assembled CA. Furthermore, molecular docking revealed an additional, novel CTD trimer interface.
Figures


Similar articles
-
Structure of HIV-1 capsid assemblies by cryo-electron microscopy and iterative helical real-space reconstruction.J Vis Exp. 2011 Aug 9;(54):3041. doi: 10.3791/3041. J Vis Exp. 2011. PMID: 21860371 Free PMC article.
-
Structural convergence between Cryo-EM and NMR reveals intersubunit interactions critical for HIV-1 capsid function.Cell. 2009 Nov 13;139(4):780-90. doi: 10.1016/j.cell.2009.10.010. Cell. 2009. PMID: 19914170 Free PMC article.
-
Motions on the millisecond time scale and multiple conformations of HIV-1 capsid protein: implications for structural polymorphism of CA assemblies.J Am Chem Soc. 2012 Apr 11;134(14):6455-66. doi: 10.1021/ja300937v. Epub 2012 Apr 2. J Am Chem Soc. 2012. PMID: 22428579 Free PMC article.
-
Cryo-EM Structure Determination Using Segmented Helical Image Reconstruction.Methods Enzymol. 2016;579:307-28. doi: 10.1016/bs.mie.2016.05.034. Epub 2016 Jun 28. Methods Enzymol. 2016. PMID: 27572732 Review.
-
The capsid protein of human immunodeficiency virus: intersubunit interactions during virus assembly.FEBS J. 2009 Nov;276(21):6098-109. doi: 10.1111/j.1742-4658.2009.07313.x. FEBS J. 2009. PMID: 19825044 Review.
Cited by
-
Disassembling the Nature of Capsid: Biochemical, Genetic, and Imaging Approaches to Assess HIV-1 Capsid Functions.Viruses. 2021 Nov 7;13(11):2237. doi: 10.3390/v13112237. Viruses. 2021. PMID: 34835043 Free PMC article. Review.
-
Quenching protein dynamics interferes with HIV capsid maturation.Nat Commun. 2017 Nov 24;8(1):1779. doi: 10.1038/s41467-017-01856-y. Nat Commun. 2017. PMID: 29176596 Free PMC article.
-
19F Dynamic Nuclear Polarization at Fast Magic Angle Spinning for NMR of HIV-1 Capsid Protein Assemblies.J Am Chem Soc. 2019 Apr 10;141(14):5681-5691. doi: 10.1021/jacs.8b09216. Epub 2019 Apr 1. J Am Chem Soc. 2019. PMID: 30871317 Free PMC article.
-
CryoEM Structure Refinement by Integrating NMR Chemical Shifts with Molecular Dynamics Simulations.J Phys Chem B. 2017 Apr 20;121(15):3853-3863. doi: 10.1021/acs.jpcb.6b13105. Epub 2017 Feb 22. J Phys Chem B. 2017. PMID: 28181439 Free PMC article.
-
Cyclophilin A stabilizes the HIV-1 capsid through a novel non-canonical binding site.Nat Commun. 2016 Mar 4;7:10714. doi: 10.1038/ncomms10714. Nat Commun. 2016. PMID: 26940118 Free PMC article.
References
-
- Wetzel R. Ideas of order for amyloid fibril structure. Structure. 2002;10:1031–1036. - PubMed
-
- True HL, Lindquist SL. A yeast prion provides a mechanism for genetic variation and phenotypic diversity. Nature. 2000;407:477–483. - PubMed
-
- Miyazawa A, Fujiyoshi Y, Unwin N. Structure and gating mechanism of the acetylcholine receptor pore. Nature. 2003;423:949–955. - PubMed
Publication types
MeSH terms
Substances
Grants and funding
LinkOut - more resources
Full Text Sources
