. 2012 Nov 1:6:51.
doi: 10.3389/fncel.2012.00051. eCollection 2012.

Age-related changes in synaptic markers and monocyte subsets link the cognitive decline of APP(Swe)/PS1 mice

Affiliations

Age-related changes in synaptic markers and monocyte subsets link the cognitive decline of APP(Swe)/PS1 mice

Gaëlle Naert et al. Front Cell Neurosci. .

Abstract

Alzheimer's disease (AD) is characterized by a progressive memory decline and numerous pathological abnormalities, including amyloid β (Aβ) accumulation in the brain and synaptic dysfunction. Here we wanted to study whether these brain changes were associated with alteration in the population of monocyte subsets since accumulating evidence supports the concept that the innate immune system plays a role in the etiology of this disease. We then determined the immune profile together with expression of genes encoding synaptic proteins and neurotrophins in APP(Swe)/PS1 mice and their age-matched wild-type (WT) littermates. We found that the progressive cognitive decline and the dramatic decrease in the expression of numerous synaptic markers and neurotrophins correlated with a major defect in the subset of circulating inflammatory monocytes. Indeed the number of CX(3)CR1(low)Ly6-C(high)CCR2(+)Gr1(+) monocytes remained essentially similar between 5 weeks and 6 months of age in APP(Swe)/PS1 mice, while these cells significantly increased in 6-month-old WT littermates. Of great interest is that the onset of cognitive decline was closely associated with the accumulation of soluble Aβ, disruption of synaptic activity, alteration in the BDNF system, and a defective production in the subset of CX(3)CR1(low)Ly6-C(high)CCR2(+)Gr1(+) monocytes. However, these memory impairments can be prevented or restored by boosting the monocytic production, using a short treatment of macrophage colony-stimulating factor (M-CSF). In conclusion, low CCR2(+) monocyte production by the hematopoietic system may be a direct biomarker of the cognitive decline in a context of AD.

Keywords: Alzheimer's disease; BDNF; CCR2; bone marrow-derived microglia; memory impairments; monocytes.


Figures
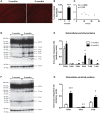
Figure 1
Figure 1
Six-month-old APPSwe/PS1 mice had higher level of Aβ soluble oligomers in the hippocampus. Anti-Aβ immunoreactivity is depicted in hippocampus of APPSwe/PS1 at 3 and 6 months of age (A). A detailed analysis of plaque quantification was performed to determine the percentage area occupied by plaques (B) of 3- and 6-month-old APPSwe/PS1. Aβ load was strongly increased at 6 months age in hippocampus. A correlation's test revealed no significant correlation between spatial memory decline (water T-maze test) and the percentage area occupied by plaques at the age of mnesic deficit occurrence (6 months) (C). Therefore, the hippocampus level of soluble Aβ was analyzed by western blotting for extracellular and intracellular-associated proteins of 3- and 6-month-old APPSwe/PS1 mice. The intensity of each band was quantified by densitometric analysis and normalized per β-actin values. Aβ species ratios (Aβ/β-actin) are represented and increased levels of Aβ soluble oligomers were observed at 6 months of age in extracellular (D–E) and intracellular (F–G). Results are expressed as the Mean ± SEM; n = 6–7; Student's t-test; *p < 0.05, **p < 0.01 and ***p < 0.001. * vs. APPSwe/PS1 at 3 months of age. Magnification 4×. Correlation test was performed using the Spearman's correlation coefficient.
Figure 2
Figure 2
Expression of BDNF and its receptors decreased in hippocampus when mnesic deficits begin in APPSwe/PS1 mice. Representative dark-field photomicrographs of in situ hybridization showed the hippocampal expression of BDNF mRNA (A) in the brain of 3- and 6-month-old WT and APPSwe/PS1 mice. For hippocampus, mRNA levels of BDNF and its receptors—TrkB.FL, TrkB.T1, and TrkB.T2—were determined by real-time qPCR and normalized relative to the level of S18 mRNA detected in each sample. At 3 months of age, APPSwe/PS1 mice exhibited similar mRNA levels of BDNF (A and B) and its receptors, TrkB.FL (C), TrkB.T1 (D), and TrkB.T2 (E). In contrast, all transcripts were significantly decreased in 6 month-old APPSwe/PS1 mice compare to WT littermates (B–E). Results are expressed as the Mean ± SEM; n = 5–9; Student's t-test; **p < 0.01 vs. WT at the same age.
Figure 3
Figure 3
Egr1, Arc, NR2A, and NR2B transcript levels in APPSwe/PS1 mice. Expression of Egr1, Arc, PSD95, AMPA1, NR2A, and NR2B mRNA were determined by in situ hybridization. Three-month-old WT and APPSwe/PS1 mice had similar mRNA levels of Egr1 (A), Arc (B), NR2A (C), and NR2B (D). In contrast, intensity of transcript signal for Egr1 (A), Arc (B), NR2A (C), and NR2B (D) was lower in the brain of APPSwe/PS1 mice than WT mice at 6 months of age. Magnification 4×.
Figure 4
Figure 4
Occurrence of mnesic deficits correlate with decreased mRNA levels of synaptic markers in hippocampus of APPSwe/PS1 mice. Real-time qPCR was used to quantify Egr1, Arc, PSD95, AMPA1, NR2A, and NR2B mRNA levels in the hippocampus. The values were normalized relative to the level of S18 mRNA detected in each sample. 3-month-old WT and APPSwe/PS1 mice had similar mRNA levels of Egr1 (A), Arc (B), PSD95 (C), AMPA1 (D), NR2A (E), and NR2B (F). In contrast, all transcripts were significantly decreased in APPSwe/PS1 mice at 6 months of age when mnesic deficits begin. Results are expressed as the Mean ± SEM; n = 5–9; Student's t-test; *p < 0.05 and **p < 0.01 vs. WT at the same age.
Figure 5
Figure 5
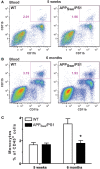
Monocyte levels are drastically diminished in 6-month-old APPSwe/PS1 mice. Circulating monocyte numbers were determined by FACS analysis within the population of leukocytes (CD45+) in the blood of WT and APPSwe/PS1 mice at 5 weeks and 6 months of age. Monocytes were characterized by CD11b and CD115 expression and were quantified within the population of CD45+ cells. At 5 weeks of age, WT and APPSwe/PS1 mice exhibited similar levels of monocytes (A and C). In contrast, APPSwe/PS1 mice had fewer monocytes than WT mice at 6 months of age (B and C). Results are expressed as the Mean ± SEM; n = 7–8; Student's t-test; *p < 0.05; * vs. WT at the same age.
Figure 6
Figure 6
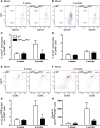
Defective production of Gr1+Ly6-ChighCCR2+ monocytes in 6-month-old APPSwe/PS1 mice. Gr1+Ly6-ChighCCR2+ monocytes were quantified by FACS analysis in the blood of WT and APPSwe/PS1 mice at 5 weeks and 6 months of age. Monocytes were determined by the presence of CD11b and CD115. Different subsets of monocytes were characterized using Gr1, Ly6-C, and CCR2 antibodies. At 5 weeks of age, WT and APPSwe/PS1 mice exhibited similar levels of Gr1+ (A and C) and Gr1 monocytes (A and D). A marked increase in the population of Gr1+ monocytes was found in the bloodstream of 6-month-old WT mice, but this phenomenon was totally prevented in APPSwe/PS1 mice (B and C). Although these mice failed to exhibit such increase in Gr1+ monocytes, they had similar number of blood Gr1 monocytes when compared to WT animals (B and D). The low frequency of Gr1+Ly6-ChighCCR2+ monocytes was confirmed in 6-month-old APPSwe/PS1 mice using more specific markers of the Gr1+ monocyte (e.g., Ly6-C and CCR2) (E–H). Results are expressed as the Mean ± SEM; n = 7–8; Student's t-test; *p < 0.05; * vs. WT at the same age.
Figure 7
Figure 7
Gr1+Ly6-ChighCCR2+ monocyte frequency is diminished in the bone marrow of 6-month-old APPSwe/PS1 mice. Leukocytes and Gr1+Ly6-ChighCCR2+ monocytes were quantified by FACS analysis in the bone marrow of WT and APPSwe/PS1 mice at 6 months of age. The leukocyte population was assessed using the CD45 marker. At 6 months of age, WT and APPSwe/PS1 mice exhibited similar levels of leukocytes (A). In the population of CD45+ cells, the inflammatory monocytes were determined by the presence of CD11b and high expression levels of Ly6-C. A marked decrease in the population of Ly6-Chigh monocytes was found in the bone marrow of 6-month-old APPSwe/PS1 mice (B). Results are expressed as the Mean ± SEM; n = 6–7; Student's t-test; *p < 0.05; * vs. WT.
Figure 8
Figure 8
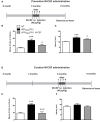
Short M-CSF treatment is able to prevent and to rescue learning and memory impairment in APPSwe/PS1 mice. APPSwe/PS1 mice received M-CSF treatment during 4 days (40 μg/Kg/day) before (at 3 months) or after occurrence of mnesic deficit (at 6 months) and were tested in the T water-maze paradigm 3 months later (A). The numbers of trials (B and E) and the latency (C and F) to accomplish the task were determined during reversal learning phase. M-CSF treatment prevented spatial memory decline generally observed in 6-month-old APPSwe/PS1 mice (B). In addition, M-CSF treatment after occurrence of mnesic impairment (at 6 months) (D) rescued spatial memory in 9-month-old APPSwe/PS1 mice (E). Results are expressed as the Mean ± SEM; n = 8–16 per group; *p < 0.05 and ***p < 0.001; * vs. WT, vs. APPSwe/PS1 mice. (One-way ANOVA was performed in each genotype using Bonferroni or Tamhane's post-hoc test).
Figure 9
Figure 9
Short M-CSF treatment increases monocyte frequency in WT and APPSwe/PS1 mice in a CCR2-dependent manner. Monocyte frequency was determined by FACS analysis within the population of CD45+ cells using the CD11b and CD115 markers in WT, CCR2−/−, APPSwe/PS1, and APPSwe/PS1/CCR2−/− mice. Mice received saline or M-CSF treatment during 4 days (40 μg/Kg/day) at the age of 4 months and blood samples were analyzed 24 h after the last injection. M-CSF treatment increased the frequency of monocytes (CD11b+CD115+) in both WT and APPSwe/PS1 groups of mice. In contrast, monocyte frequency remained very low in CCR2−/− and APPSwe/PS1/CCR2−/− mice treated or not with the cytokine. Results are expressed as the Mean ± SEM; n = 5–8; Student's t-test; *p < 0.05; **p < 0.01; * vs. saline treatment in the same genotype.

Similar articles

Cited by

References

    1. Ango F., Pin J. P., Tu J. C., Xiao B., Worley P. F., Bockaert J., et al. (2000). Dendritic and axonal targeting of type 5 metabotropic glutamate receptor is regulated by homer1 proteins and neuronal excitation. J. Neurosci. 20, 8710–8716 - PMC - PubMed
    1. Auffray C., Sieweke M. H., Geissmann F. (2009). Blood monocytes: development, heterogeneity, and relationship with dendritic cells. Annu. Rev. Immunol. 27, 669–692 10.1146/annurev.immunol.021908.132557 - DOI - PubMed
    1. Babcock A. A., Kuziel W. A., Rivest S., Owens T. (2003). Chemokine expression by glial cells directs leukocytes to sites of axonal injury in the CNS. J. Neurosci. 23, 7922–7930 - PMC - PubMed
    1. Blalock E. M., Chen K. C., Sharrow K., Herman J. P., Porter N. M., Foster T. C., et al. (2003). Gene microarrays in hippocampal aging: statistical profiling identifies novel processes correlated with cognitive impairment. J. Neurosci. 23, 3807–3819 - PMC - PubMed
    1. Bloomer W. A., VanDongen H. M., VanDongen A. M. (2008). Arc/Arg3.1 translation is controlled by convergent N-methyl-D-aspartate and Gs-coupled receptor signaling pathways. J. Biol. Chem. 283, 582–592 10.1074/jbc.M702451200 - DOI - PubMed