

Content-specific fronto-parietal synchronization during visual working memory
- PMID: 23118014
- PMCID: PMC4038369
- DOI: 10.1126/science.1224000
Content-specific fronto-parietal synchronization during visual working memory
Abstract
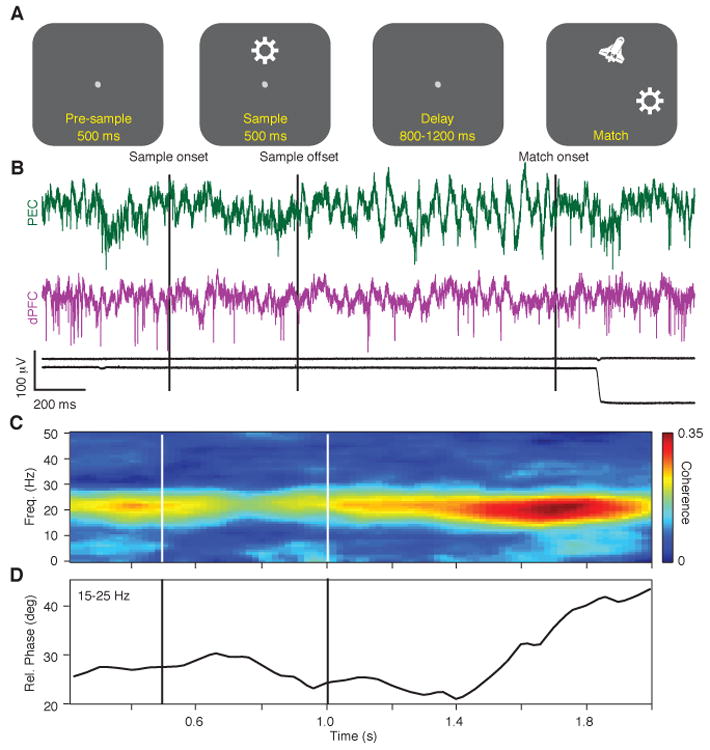
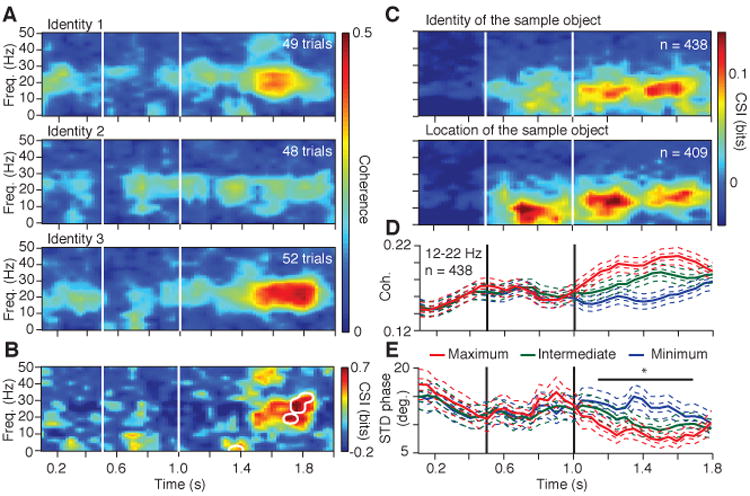
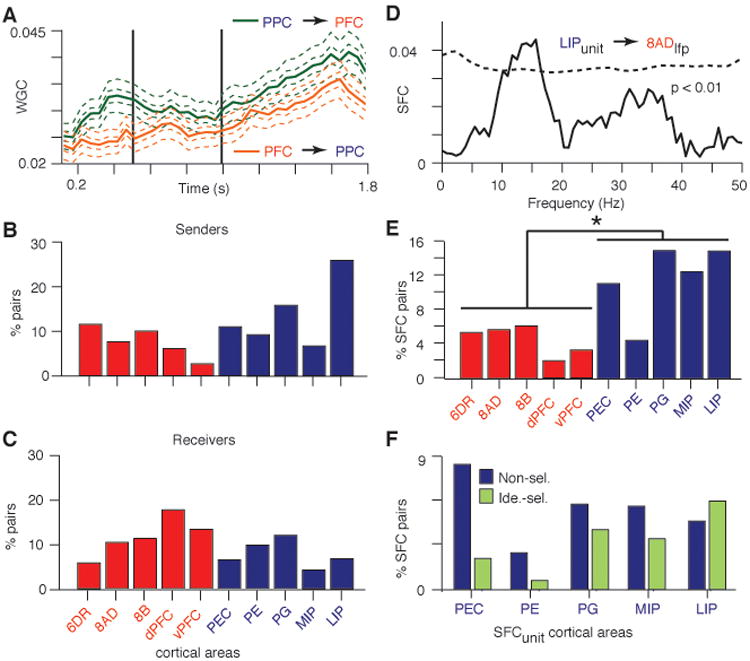
Lateral prefrontal and posterior parietal cortical areas exhibit task-dependent activation during working memory tasks in humans and monkeys. Neurons in these regions become synchronized during attention-demanding tasks, but the contribution of these interactions to working memory is largely unknown. Using simultaneous recordings of neural activity from multiple areas in both regions, we find widespread, task-dependent, and content-specific synchronization of activity across the fronto-parietal network during visual working memory. The patterns of synchronization are prevalent among stimulus-selective neurons and are governed by influences arising in parietal cortex. These results indicate that short-term memories are represented by large-scale patterns of synchronized activity across the fronto-parietal network.
Figures
Similar articles
-
Structuring of Abstract Working Memory Content by Fronto-parietal Synchrony in Primate Cortex.Neuron. 2018 Aug 8;99(3):588-597.e5. doi: 10.1016/j.neuron.2018.07.025. Neuron. 2018. PMID: 30092215
-
Mnemonic Encoding and Cortical Organization in Parietal and Prefrontal Cortices.J Neurosci. 2017 Jun 21;37(25):6098-6112. doi: 10.1523/JNEUROSCI.3903-16.2017. Epub 2017 May 24. J Neurosci. 2017. PMID: 28539423 Free PMC article.
-
Matching patterns of activity in primate prefrontal area 8a and parietal area 7ip neurons during a spatial working memory task.J Neurophysiol. 1998 Jun;79(6):2919-40. doi: 10.1152/jn.1998.79.6.2919. J Neurophysiol. 1998. PMID: 9636098
-
Development of a superior frontal-intraparietal network for visuo-spatial working memory.Neuropsychologia. 2006;44(11):2171-7. doi: 10.1016/j.neuropsychologia.2005.11.019. Epub 2006 Jan 6. Neuropsychologia. 2006. PMID: 16405923 Review.
-
Common fronto-parietal activity in attention, memory, and consciousness: shared demands on integration?Conscious Cogn. 2005 Jun;14(2):390-425. doi: 10.1016/j.concog.2004.10.003. Epub 2004 Dec 8. Conscious Cogn. 2005. PMID: 15950889 Review.
Cited by
-
Focused Representation of Successive Task Episodes in Frontal and Parietal Cortex.Cereb Cortex. 2020 Mar 14;30(3):1779-1796. doi: 10.1093/cercor/bhz202. Cereb Cortex. 2020. PMID: 31690931 Free PMC article.
-
Towards a better understanding of information storage in visual working memory.Vis cogn. 2021;29(7):437-445. doi: 10.1080/13506285.2021.1946230. Epub 2021 Jul 1. Vis cogn. 2021. PMID: 35496937 Free PMC article.
-
Directed Interaction Between Monkey Premotor and Posterior Parietal Cortex During Motor-Goal Retrieval from Working Memory.Cereb Cortex. 2018 May 1;28(5):1866-1881. doi: 10.1093/cercor/bhy035. Cereb Cortex. 2018. PMID: 29481586 Free PMC article.
-
Connectivity, pharmacology, and computation: toward a mechanistic understanding of neural system dysfunction in schizophrenia.Front Psychiatry. 2013 Dec 24;4:169. doi: 10.3389/fpsyt.2013.00169. Front Psychiatry. 2013. PMID: 24399974 Free PMC article.
-
Distinct neuronal interactions in anterior inferotemporal areas of macaque monkeys during retrieval of object association memory.J Neurosci. 2014 Jul 9;34(28):9377-88. doi: 10.1523/JNEUROSCI.0600-14.2014. J Neurosci. 2014. PMID: 25009270 Free PMC article.
References
Publication types
MeSH terms
Grants and funding
LinkOut - more resources
Full Text Sources
Other Literature Sources
