

Genomic and proteomic profiling reveals reduced mitochondrial function and disruption of the neuromuscular junction driving rat sarcopenia
- PMID: 23109432
- PMCID: PMC3554128
- DOI: 10.1128/MCB.01036-12
Genomic and proteomic profiling reveals reduced mitochondrial function and disruption of the neuromuscular junction driving rat sarcopenia
Abstract
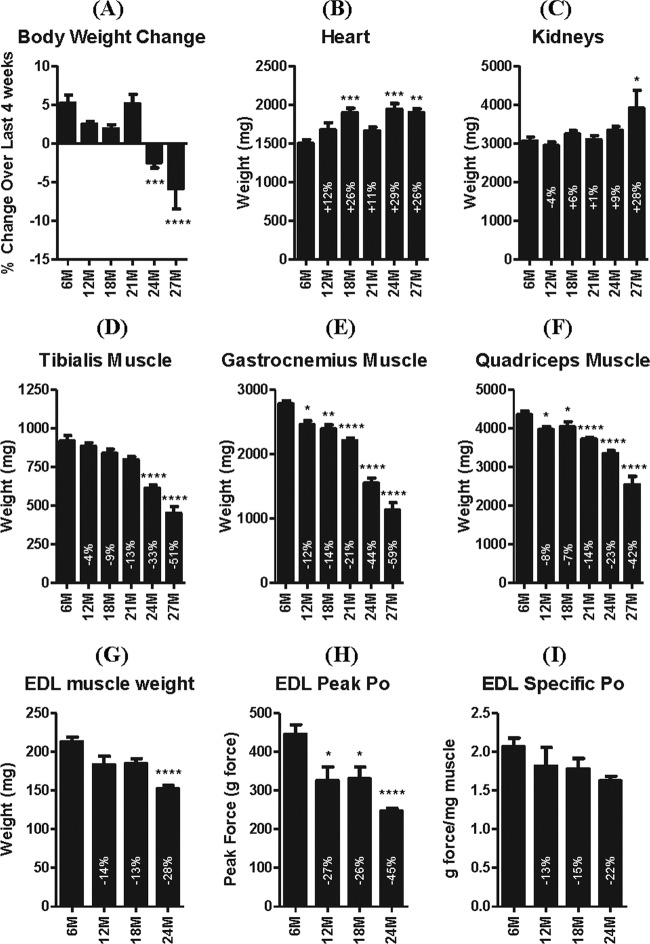
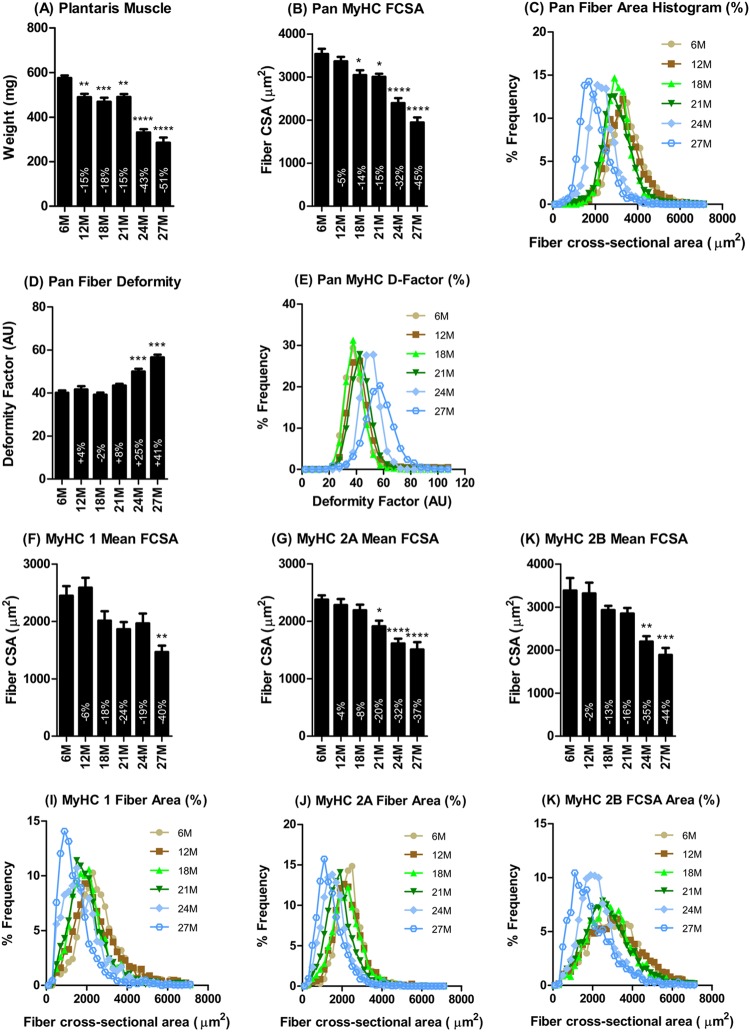
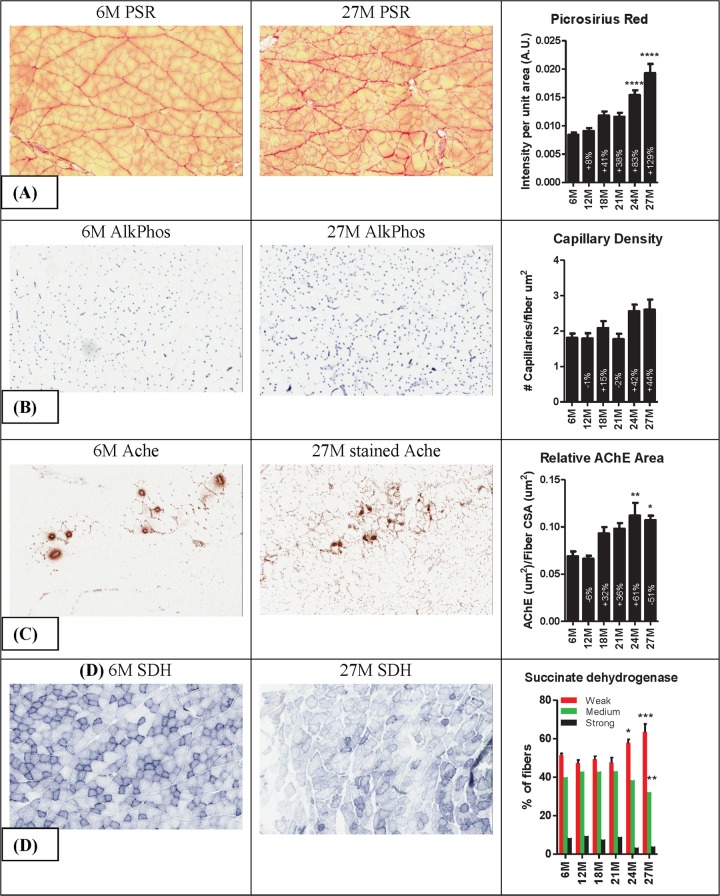
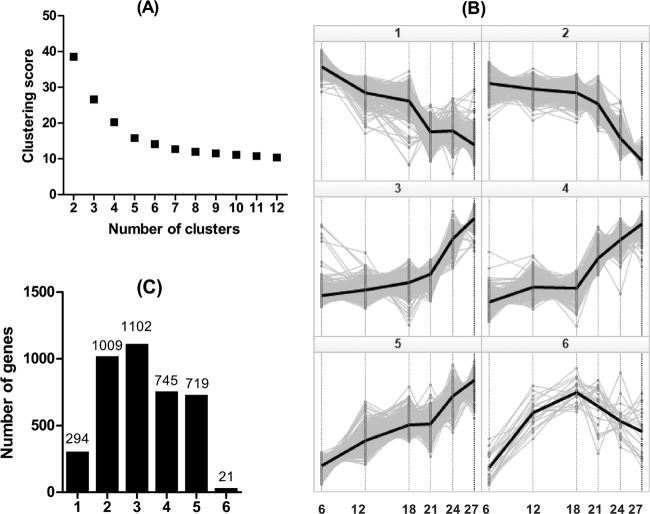
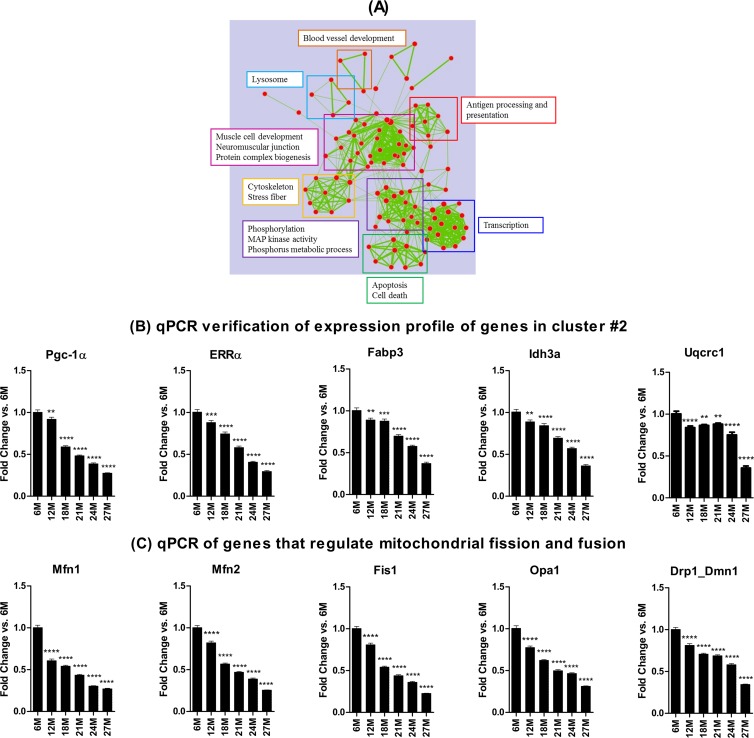
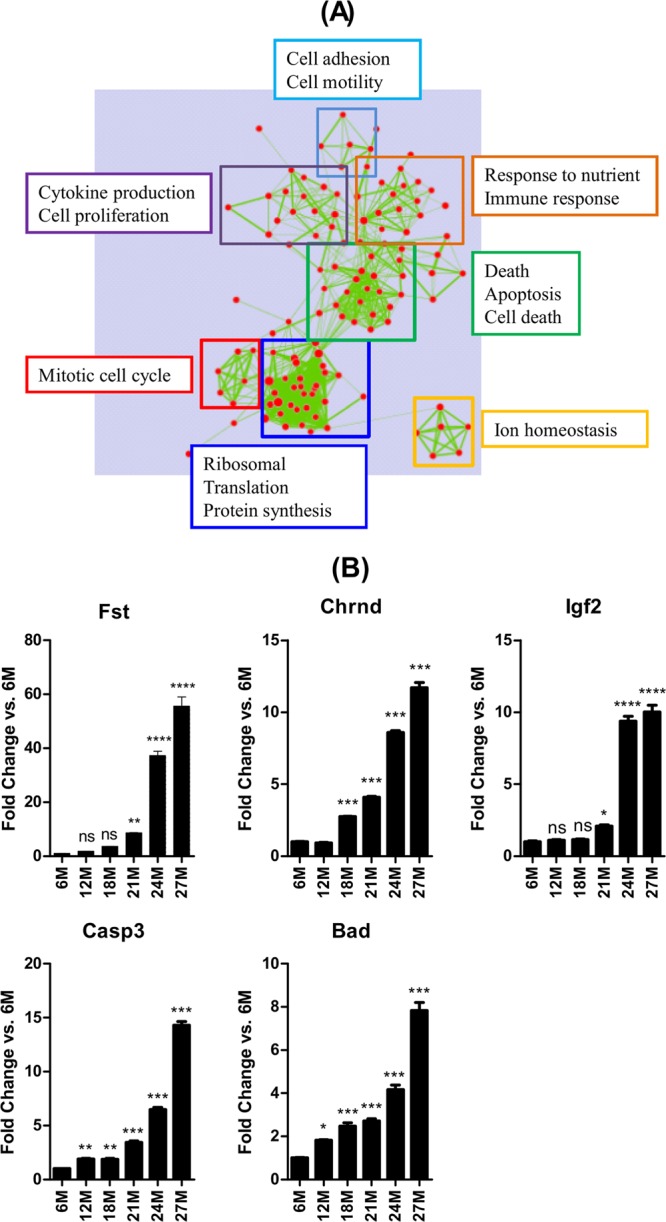
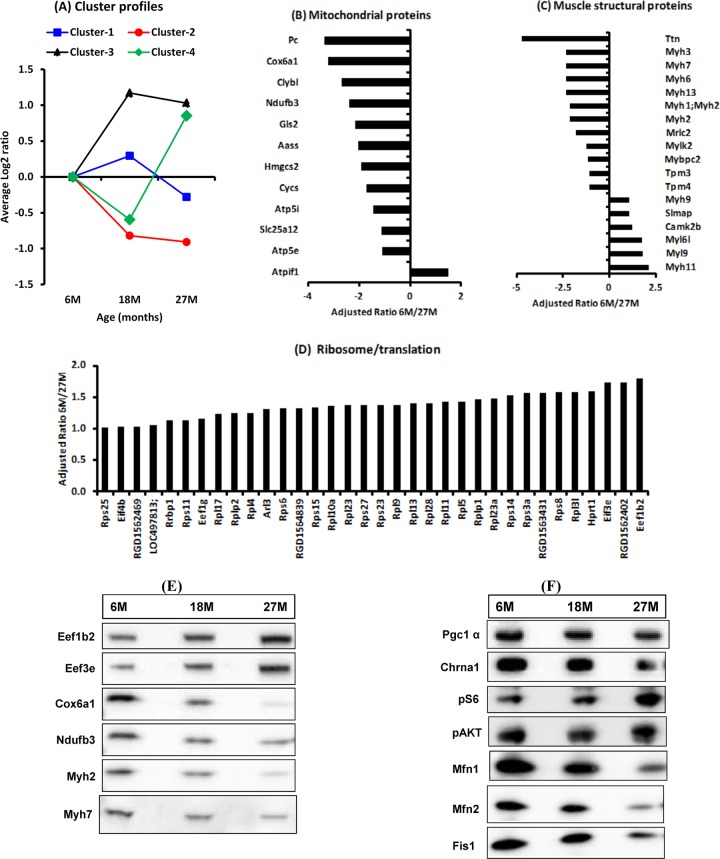
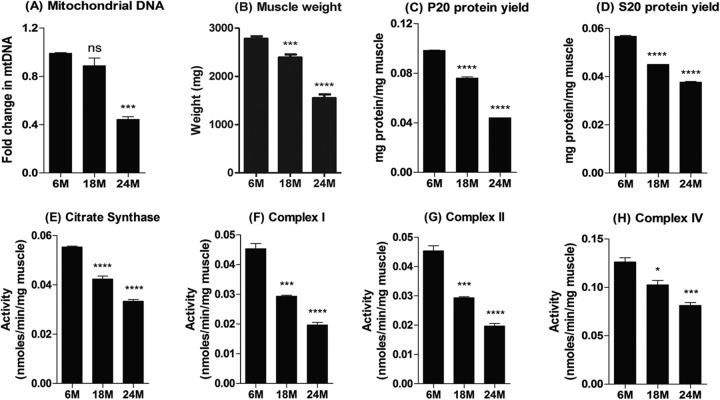
Molecular mechanisms underlying sarcopenia, the age-related loss of skeletal muscle mass and function, remain unclear. To identify molecular changes that correlated best with sarcopenia and might contribute to its pathogenesis, we determined global gene expression profiles in muscles of rats aged 6, 12, 18, 21, 24, and 27 months. These rats exhibit sarcopenia beginning at 21 months. Correlation of the gene expression versus muscle mass or age changes, and functional annotation analysis identified gene signatures of sarcopenia distinct from gene signatures of aging. Specifically, mitochondrial energy metabolism (e.g., tricarboxylic acid cycle and oxidative phosphorylation) pathway genes were the most downregulated and most significantly correlated with sarcopenia. Also, perturbed were genes/pathways associated with neuromuscular junction patency (providing molecular evidence of sarcopenia-related functional denervation and neuromuscular junction remodeling), protein degradation, and inflammation. Proteomic analysis of samples at 6, 18, and 27 months confirmed the depletion of mitochondrial energy metabolism proteins and neuromuscular junction proteins. Together, these findings suggest that therapeutic approaches that simultaneously stimulate mitochondrogenesis and reduce muscle proteolysis and inflammation have potential for treating sarcopenia.
Figures
Similar articles
-
Molecular analyses provide insight into mechanisms underlying sarcopenia and myofibre denervation in old skeletal muscles of mice.Int J Biochem Cell Biol. 2014 Aug;53:174-85. doi: 10.1016/j.biocel.2014.04.025. Epub 2014 May 13. Int J Biochem Cell Biol. 2014. PMID: 24836906
-
Comparison of Whole Body SOD1 Knockout with Muscle-Specific SOD1 Knockout Mice Reveals a Role for Nerve Redox Signaling in Regulation of Degenerative Pathways in Skeletal Muscle.Antioxid Redox Signal. 2018 Feb 1;28(4):275-295. doi: 10.1089/ars.2017.7249. Epub 2017 Dec 12. Antioxid Redox Signal. 2018. PMID: 29065712 Free PMC article.
-
Effects of IGF-1 isoforms on muscle growth and sarcopenia.Aging Cell. 2019 Jun;18(3):e12954. doi: 10.1111/acel.12954. Epub 2019 Apr 5. Aging Cell. 2019. PMID: 30953403 Free PMC article.
-
Unraveling the causes of sarcopenia: Roles of neuromuscular junction impairment and mitochondrial dysfunction.Physiol Rep. 2024 Jan;12(1):e15917. doi: 10.14814/phy2.15917. Physiol Rep. 2024. PMID: 38225199 Free PMC article. Review.
-
Mechanisms Regulating Neuromuscular Junction Development and Function and Causes of Muscle Wasting.Physiol Rev. 2015 Jul;95(3):809-52. doi: 10.1152/physrev.00033.2014. Physiol Rev. 2015. PMID: 26109340 Review.
Cited by
-
Impact of Mitophagy and Mitochondrial Unfolded Protein Response as New Adaptive Mechanisms Underlying Old Pathologies: Sarcopenia and Non-Alcoholic Fatty Liver Disease.Int J Mol Sci. 2020 Oct 18;21(20):7704. doi: 10.3390/ijms21207704. Int J Mol Sci. 2020. PMID: 33081022 Free PMC article. Review.
-
Integrated expression analysis of muscle hypertrophy identifies Asb2 as a negative regulator of muscle mass.JCI Insight. 2016 Apr 21;1(5):e85477. doi: 10.1172/jci.insight.85477. JCI Insight. 2016. PMID: 27182554 Free PMC article.
-
Hallmarks of ageing in human skeletal muscle and implications for understanding the pathophysiology of sarcopenia in women and men.Clin Sci (Lond). 2023 Nov 29;137(22):1721-1751. doi: 10.1042/CS20230319. Clin Sci (Lond). 2023. PMID: 37986616 Free PMC article.
-
Effects of Royal Jelly Administration on Endurance Training-Induced Mitochondrial Adaptations in Skeletal Muscle.Nutrients. 2018 Nov 12;10(11):1735. doi: 10.3390/nu10111735. Nutrients. 2018. PMID: 30424505 Free PMC article.
-
Mitochondrial Quality Control in Sarcopenia: Updated Overview of Mechanisms and Interventions.Aging Dis. 2021 Dec 1;12(8):2016-2030. doi: 10.14336/AD.2021.0427. eCollection 2021 Dec. Aging Dis. 2021. PMID: 34881083 Free PMC article. Review.
References
-
- Janssen I, Baumgartner RN, Ross R, Rosenberg IH, Roubenoff R. 2004. Skeletal muscle cutpoints associated with elevated physical disability risk in older men and women. Am. J. Epidemiol. 159:413–421 - PubMed
-
- Metter EJ, Talbot LA, Schrager M, Conwit R. 2002. Skeletal muscle strength as a predictor of all-cause mortality in healthy men. J. Gerontol. A Biol. Sci. Med. Sci. 57:B359–B365 - PubMed
-
- Balagopal P, Rooyackers OE, Adey DB, Ades PA, Nair KS. 1997. Effects of aging on in vivo synthesis of skeletal muscle myosin heavy- chain and sarcoplasmic protein in humans. Am. J. Physiol. 273:E790–E800 - PubMed
-
- Gray C, MacGillivray TJ, Eeley C, Stephens NA, Beggs I, Fearon KC, Greig CA. 2011. Magnetic resonance imaging with K-means clustering objectively measures whole muscle volume compartments in sarcopenia/cancer cachexia. Clin. Nutr. 30:106–111 - PubMed
-
- Lexell J. 1995. Human aging, muscle mass, and fiber type composition. J. Gerontol. A Biol. Sci. Med. Sci. 50(Spec No):11–16 - PubMed
MeSH terms
Substances
LinkOut - more resources
Full Text Sources
Other Literature Sources
Medical
Molecular Biology Databases