. 2012 Dec;22(12):2399-408.
doi: 10.1101/gr.138776.112. Epub 2012 Oct 25.

CpG islands and GC content dictate nucleosome depletion in a transcription-independent manner at mammalian promoters

Affiliations

CpG islands and GC content dictate nucleosome depletion in a transcription-independent manner at mammalian promoters

Romain Fenouil et al. Genome Res. 2012 Dec.

Abstract

One clear hallmark of mammalian promoters is the presence of CpG islands (CGIs) at more than two-thirds of genes, whereas TATA boxes are only present at a minority of promoters. Using genome-wide approaches, we show that GC content and CGIs are major promoter elements in mammalian cells, able to govern open chromatin conformation and support paused transcription. First, we define three classes of promoters with distinct transcriptional directionality and pausing properties that correlate with their GC content. We further analyze the direct influence of GC content on nucleosome positioning and depletion and show that CpG content and CGI width correlate with nucleosome depletion both in vivo and in vitro. We also show that transcription is not essential for nucleosome exclusion but influences both a weak +1 and a well-positioned nucleosome at CGI borders. Altogether our data support the idea that CGIs have become an essential feature of promoter structure defining novel regulatory properties in mammals.


Figures
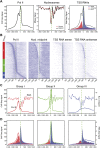
Figure 1.
Figure 1.
Three groups of mammalian promoters are defined by Pol II occupancy and correlate with directionality of paused transcripts and nucleosome occupancy. (A) Average profiling of Pol II (left), nucleosomes (middle), and short directional TSS-RNAs (right) based on ChIP-seq, MNase-seq, and strand-specific RNA-seq, respectively. The analysis was performed on 1727 active promoters in mouse primary CD4+ CD8+ (DP) sorted T-cells (top 20% of Pol II signal distribution on selected promoters). The main aNDR is delimited by −1 and +1 nucleosomes around the TSS (dashed green line), approximately between −200 bp and +100 bp around the TSS. Nucleosomal midpoints (middle, black line) show a more marked periodicity than pure nucleosome occupancy (red) and also reveal strong +2, +3 nucleosomes. (B) Heat map of features described in A on promoters sorted by position of the main Pol II accumulation area (peak) from the most 5′ to the most 3′ around TSSs. Three main groups are defined by Pol II occupancy (left panel): class I most 5′ (red bar), class II TSS-proximal (green bar), and class III most 3′ (blue bar). The corresponding heat maps for nucleosome midpoints and short TSSs RNA heat maps are indicated. (C) Pol II (solid line) and nucleosome midpoint profiling (dashed lines) of the three groups defined in B. (D) Profiling of short sense (blue) and antisense (red) TSS-RNAs from the groups defined in B. Pol II corresponding profiles are indicated as in C.
Figure 2.
Figure 2.
Nucleosome position at the borders of CpG-rich areas in the three classes of Pol II–bound promoters. For the three classes of promoters defined in Figure 1, CpG and GC content are displayed side by side with nucleosome midpoints and densities. A more complete analysis of this cluster is also presented in Supplemental Figure 1.
Figure 3.
Figure 3.
GC content at promoters conditions +1 nucleosome strength and correlates with aNDRs in GC-rich areas. (A) Heat maps of CpG dinucleotides, CpG islands, and nucleosome density, ordered by increasing GC content, in murine DP T-cells at all 8634 promoters (excluding those in close proximity to other annotations) and centered on the TSSs. On the left of the heat maps, the six groups A–F (red to violet boxes) of increasing GC content are represented along with the presence of CGIs in each group (blue bar represent CGIs, and white bars non-CGI promoter). The percentages of CGI promoters in each group from top to bottom are 4%, 34%, 55%, 65%, 78%, and 93%. Therefore, the first two groups can be classified as CGI-poor. The profiles of CpG content and nucleosome densities for all promoters (top) or the six subgroups A–F are shown on the right. The red and green lines on the CGIs and nucleosome density heat maps show the trend lines of the CGIs borders (see Methods) starting from group B because group A does not contain a significant amount of CGIs. (Orange stars) Transition point from which +1 nucleosome densities switch from a correlation to an anti-correlation pattern with GC content. (B) Correlation of CpG peak length and aNDR size within CGI-rich groups. A linear regression of CGI length versus nucleosome occupancy, divided into 80 classes, shows a high correlation (R = 0.91). (C) GC content correlate (in GC-low areas) and anti-correlate in GC-rich areas with MNase signal at +1 nucleosome proximity. Promoters were divided into 80 equal groups of increasing +1 GC content and plotted against MNase signal. Nucleosome density increases and then decreases after a 0.58 GC content threshold. (D) Transitions in the major nucleosome occupancy from position +1 to +4 with increasing GC content. Occupancy levels for +1 to +4 nucleosomes were measured around the midpoint position calculated on all promoters.
Figure 4.
Figure 4.
In vivo and in vitro human nucleosomes show a similar inversion of correlation trends. (A) Comparison of in vivo– and in vitro–reconstituted nucleosomes in human T-cells (CD4+ or SP) or using T-cell-derived genomic DNA and presented as in Figure 3A at all promoters (7021 regions). Whereas in vivo the aNDR appears in subgroup B, it appears in group D in vitro. (B) Correlation of CpG peak length and aNDR size in vitro and in vivo within CGI-rich groups as in Figure 3B. (C) GC content and MNase signal at +1 nucleosome proximity (as in Fig. 3C) from data presented in A. A similar trend of inversion from correlation to anti-correlation is observed between +1 nucleosome density and GC content but with different GC content thresholds.
Figure 5.
Figure 5.
Pol II occupancy influences nucleosome positioning but not nucleosome depletion at CGI promoters. Heat maps of CpG content, nucleosome density, and nucleosome midpoints ordered by increasing GC content are shown for 2590 Pol II–containing (A) and 2590 Pol II–depleted (B) CGI promoters only. CGI border trend lines are shown on the CpG heat maps as for Figure 3A. (C) Corresponding average profiles of subgroups A–F (gene sextiles from lowest to highest GC content) for nucleosome densities and CpG dinucleotide scores are shown.
Figure 6.
Figure 6.
Enhanced nucleosome positioning in Pol II–containing CGI promoters. Average positions of the −1 to +4 nucleosomes midpoint shown in Figure 5, A and B, are indicated on the top panel (all CGI promoters). Gene group colors A–F in the middle and bottom panels correspond to sextiles of increasing GC content. For Pol II–containing promoters, a clearer nucleosome periodicity as well as positioning is visible when compared with Pol II–depleted promoters.
Figure 7.
Figure 7.
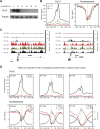
Pol II disruption in vivo reduces aNDRs only moderately and results in an increase of the +1 nucleosome. (A) To investigate the effect of Pol II presence on aNDRs, we stripped Pol II from the chromatin by treating the human Raji B-cell line with α-amanitin for the indicated time points. Western blot samples were analyzed at 12 h, 18 h, 24 h, 36 h, and 48 h and showed Pol II disappearance in the latter two points. Tubulin (lower panel) was used as an internal control to check equal protein loading. At t0, t24, and t36, Pol II ChIP-seq and MNase-seq experiments were performed as indicated. (B) Genome-wide analysis of nucleosome occupancy and Pol II recruitment following treatment at 1504 Pol II–enriched promoters (top 20%). As expected, Pol II signals around the TSS decreased over time (left). Nucleosome density slightly increased downstream from the TSS, indicating narrowing of the effective aNDR area (right) and an increase of the +1 nucleosome. (C) Examples showing the difference of Pol II occupation and nucleosome density across the TRIM4 and PPIA genes. ChIP-seq and MNase-seq data were scaled such that the represented units correspond to an equivalent amount of sequenced tags. (Arrow) Position of the +1 nucleosome. (D) Effect of GC content on aNDRs after Pol II removal. Three groups of GC content were built for the group of Pol II–enriched promoters shown in B. CpG scores, nucleosome densities (bottom panels), and Pol II ChIP-seq signal (top panels), before and after treatment are displayed. A stronger aNDR reduction, but not disruption, is observed for the group with the highest GC (and CpG) content.

Similar articles

Cited by

References

    1. Blackledge NP, Zhou JC, Tolstorukov MY, Farcas AM, Park PJ, Klose RJ 2010. CpG islands recruit a histone H3 lysine 36 demethylase. Mol Cell 38: 179–190 - PMC - PubMed
    1. Boyer LA, Plath K, Zeitlinger J, Brambrink T, Medeiros LA, Lee TI, Levine SS, Wernig M, Tajonar A, Ray MK, et al. 2006. Polycomb complexes repress developmental regulators in murine embryonic stem cells. Nature 441: 349–353 - PubMed
    1. Choi JK 2010. Contrasting chromatin organization of CpG islands and exons in the human genome. Genome Biol 11: R70 doi: 10.1186/gb-2010-11-7-r70 - PMC - PubMed
    1. Core LJ, Waterfall JJ, Lis JT 2008. Nascent RNA sequencing reveals widespread pausing and divergent initiation at human promoters. Science 322: 1845–1848 - PMC - PubMed
    1. Gilchrist DA, Dos Santos G, Fargo DC, Xie B, Gao Y, Li L, Adelman K 2010. Pausing of RNA polymerase II disrupts DNA-specified nucleosome organization to enable precise gene regulation. Cell 143: 540–551 - PMC - PubMed

Publication types