. 2012 Oct 29;199(3):527-44.
doi: 10.1083/jcb.201203025. Epub 2012 Oct 22.

N-WASP coordinates the delivery and F-actin-mediated capture of MT1-MMP at invasive pseudopods

Affiliations

N-WASP coordinates the delivery and F-actin-mediated capture of MT1-MMP at invasive pseudopods

Xinzi Yu et al. J Cell Biol. .

Abstract

Metastasizing tumor cells use matrix metalloproteases, such as the transmembrane collagenase MT1-MMP, together with actin-based protrusions, to break through extracellular matrix barriers and migrate in dense matrix. Here we show that the actin nucleation-promoting protein N-WASP (Neural Wiskott-Aldrich syndrome protein) is up-regulated in breast cancer, and has a pivotal role in mediating the assembly of elongated pseudopodia that are instrumental in matrix degradation. Although a role for N-WASP in invadopodia was known, we now show how N-WASP regulates invasive protrusion in 3D matrices. In actively invading cells, N-WASP promoted trafficking of MT1-MMP into invasive pseudopodia, primarily from late endosomes, from which it was delivered to the plasma membrane. Upon MT1-MMP's arrival at the plasma membrane in pseudopodia, N-WASP stabilized MT1-MMP via direct tethering of its cytoplasmic tail to F-actin. Thus, N-WASP is crucial for extension of invasive pseudopods into which MT1-MMP traffics and for providing the correct cytoskeletal framework to couple matrix remodeling with protrusive invasion.


Figures

Figure 1.
Figure 1.
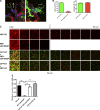
N-WASP expression increases in both human and mouse invasive breast cancers. (A) Immunohistochemical staining of N-WASP in human breast cancer tissues. Left and middle panels show expression of N-WASP in human normal tissue and DCIS. The right panel shows the expression level of N-WASP in human invasive ductal carcinoma. The insets show enlarged images of N-WASP staining in different tissues. (B) Bar graphs indicate histochemistry scores of normal/DCIS and invasive breast cancer cores from a 75-core human breast cancer TMA. All error bars indicate means ± SD; *, P < 0.05 by t test. (C) Immunohistochemical staining of N-WASP in mouse virgin and lactating mammary glands. Samples from three mice were stained and imaged. The insets show enlarged images of N-WASP staining in mouse virgin and lactating mammary glands. (D) Immunohistochemical staining of N-WASP in primary tumors from MMTV-PyMT (n = 9) and MMTV-erbB2 (n = 5) mouse models. Bars: (main panels) 200 µm; (insets) 100 µm.
Figure 2.
Figure 2.
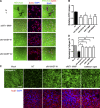
N-WASP mediates leading cell collective invasion into 3D matrices. (A) Cells that migrated into Matrigel plugs in an inverted invasion assay were stained with CalceinAM and visualized by confocal microscopy. Serial optical sections were captured at 15-µm intervals and presented as a sequence in which the individual optical sections are placed alongside one another, with increasing depth from left to right as indicated. The assays were quantified by measuring the fluorescence intensity of cells penetrating 30 µm and greater. 0 µm indicates cells that crawled through the filter but did not enter the gel. The invasion capacity was expressed as a percentage of the total fluorescence intensity of all cells within the plug, as shown in the bar graph. At least three independent experiments were performed. All error bars indicate means ± SD; **, P < 0.01 by a t test. Bar, 100 µm. (B) Matrigel plugs containing cells from inverted invasion assays were fixed and stained with phalloidin (actin, red) and DAPI (DNA, blue). Strands of invading cells are shown in cross section and side views. Bar, 50 µm.
Figure 3.
Figure 3.
N-WASP is required for extension of elongated matrix degrading pseudopods and propulsion through dense matrix. (A) MDA-MB-231 cells treated with siRNA NT and N-WASP invading under Matrigel (photos show 5 mg/ml Matrigel, bar graphs show concentrations as indicated) in a CIA. Black lines indicate the start of the cell front at t = 0 h. Cell migration speed and persistence in CIA are shown in the bar graph. Persistence is obtained by using the Euclidean distance divided by the total distance between the start and end points of cell movement. At least three independent experiments were performed and quantified. Error bars indicate means ± SD; **, P < 0.01 by t test. Bar, 100 µm. (B) Cells invading in CIA were fixed and stained with phalloidin (actin, red) and DAPI (DNA, blue) for confocal imaging. The length of actin pseudopods and the ratio of cell length/width in CIA are shown in the bar graph. Error bars indicate means ± SD; **, P < 0.01; *, P < 0.05 by t test. At least 30 cells were analyzed in three independent experiments. Bars, 20 µm.
Figure 4.
Figure 4.
N-WASP is required for path generation during invasion. (A) Equal numbers of RFP-expressing cells transfected with either NT or N-WASP siRNA (red) were mixed with GFP-labeled cells treated with NT siRNA (green) in CIA. Cells were fixed and stained for DNA (blue) to show path-generating and following cells in the invading strands. Arrowheads indicate leading cells of invasive cell strands. Arrows indicate the direction to the wound edge. At least three independent experiments were performed and quantified. Bar, 10 µm. (B) Bar graphs indicate the percentage of leading and total cells of GFP- and RFP-positive cells. Error bars indicate means ± SD; **, P < 0.01 by t test. (C) A similar setup was used as in A, except that NT or N-WASP siRNA RFP-expressing cells alone were seeded for inverted invasion assay. Serial optical sections were captured at 10-µm intervals and presented as a sequence in which the individual optical sections are placed alongside one another with increasing depth from left to right as indicated. Images at 0 µm indicate cells that came though the filter but did not enter the gel. Invasion capacity was expressed as a percentage of the total fluorescence intensity of all cells invading beyond 30 µm within the plug as shown in the bar graph. At least three independent experiments were performed and quantified. Bar, 100 µm.
Figure 5.
Figure 5.
N-WASP is crucial for pericellular collagenolysis in vitro and on native BMs. (A) Immunofluorescence images of cells on FITC-conjugated type-I collagen film (green). Cells were labeled for filamentous actin (red, phalloidin) and DNA (blue, DAPI). Bar, 50 µm. (B) Quantification of FITC fluorescence release after incubating cells with DQ collagen matrix from three independent experiments. (C) MDA-MB-231 cells were cultured atop of mouse peritoneal BM for 3 d and then fixed and stained for collagen IV (green), actin (phalloidin, red), and DNA (DAPI, blue). The cells remodel and degrade BM, and the remaining collagen IV is shown by antibody staining (green). Bar, 100 µm. (D) The total fluorescence intensity of remaining collagen IV is represented in the bar graph. At least three independent experiments were performed and quantified. Error bars indicate means ± SD; **, P < 0.01; *, P < 0.05 by t test.
Figure 6.
Figure 6.
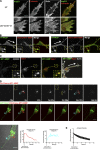
MT1-MMP traffics from a late endosomal compartment to the plasma membrane and associates with N-WASP. (A) NT and N-WASP knockdown cells invading in CIA were fixed and stained with anti-Arp2/3 and cortactin to reveal actin-rich puncta (arrowheads) in NT cells (top). (B) Immunofluorescence images of invading cells expressing mCherry-MT1-MMP (red) and staining for endogenous N-WASP (green) in CIA, with arrows pointing toward the wound edge. Bar, 10 µm. Enlarged images show details (boxed regions) of the invasive pseudopods containing MT1-MMP vesicles and N-WASP puncta. (C) Endogenous MT1-MMP vesicles colocalize with endogenous Rab7. Arrows point toward the wound edge. Bar, 20 µm. Inset images show the LE/LY vesicles containing both MT1-MMP and Rab7 (enlarged views of the boxed regions). (D) MDA-MB-231 cells expressing PA mCherry-MT1-MMP (red) and GFP-Rab7 (green) were plated in CIA and imaged by confocal microscopy. Photo-activation was achieved with a 405-nm laser aimed at a small area (region A) containing GFP-Rab7–positive vesicles (also MT1-MMP), marked by the red box. Images were then captured at 3.2 s per frame over a period of >6 min (Video 6). Single-section confocal images of activated mCherry-MT1-MMP and images of merged mCherry-MT1-MMP and GFP-Rab7 at certain time points were presented. The insets are enlarged images showing increased signals of photoactivated mCherry-MT1-MMP on the plasma membrane area near the activated vesicles. The enlarged area is indicated with the yellow dotted line at time point “2 m 29 s.” The same areas are shown in time points “0 s” and “3 m 37 s.” The integrated fluorescence intensity of activated region A (red) and a area of plasma membrane (region B) near the activated vesicles (light blue) was quantified for each frame of Video 6, and the values are plotted against elapsed time. (E) Quantification of fluorescence intensity of activated mCherry-MT1-MMP vesicles in multiple experiments indicated the exit rate of photoactivated mCherry-MT1-MMP from the Rab7-positive compartment (n = 10). Error bars indicate means ± SEM. Bars: (A) 20 µm; (B) 5 µm; (C) 1 µm; (D) 10 µm; (B–D, insets) 1 µm.
Figure 7.
Figure 7.
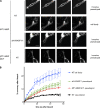
MT1-MMP is tethered to invasive pseudopods in an N-WASP–dependent manner. (A) MDA-MB-231 were transfected with mCherry-MT1-MMP or mCherry-MT1-MMPΔCT, as indicated, as well as GFP-actin, and subjected to CIA. Selected actin-rich areas in invasive pseudopods or areas of the cell body (boxes shown in A and quantified in B) of NT or N-WASP–depleted cells as indicated were photobleached using a 405-nm laser, and recovery of mCherry-MT1-MMP fluorescence was recorded for 58 s. (B) Quantification of fluorescence recovery was of at least 30 cells in three independent experiments. Error bars indicate means ± SEM. Bar, 10 µm.
Figure 8.
Figure 8.
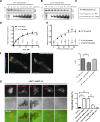
MT1-MMP actin binding is both necessary and sufficient to induce matrix degradation. (A–C) 25 µM final concentration of WT (A and C) cytoplasmic MT1-MMP tail peptide or LLY/AAA (B and C) cytoplasmic MT1-MMP tail peptide were tested for their ability to bind to increasing amounts of F-actin in an in vitro binding assay. Actin was allowed to polymerize for 1 h. After centrifugation, 10% of total F-actin pellets (p) and supernatants (s) were run on a 4–12% NuPAGE gel using MES running buffer. (D) Quantification of Coomassie gel densitometry of peptide bands. n = 5. (E) Relative steady-state fluorescence anisotropy was measured between IAEDANS-labeled filamentous actin (2 µM) and increasing concentration of MT1 peptide constructs: MT1_tail (closed squares), MT1tail_L1Y/A (open circles), and MT1tail_scrambled (open triangles). The binding curve was fitted with the equation given in the Materials and methods section (“Steady-state fluorescence anisotropy experiments”), and the Kd value was calculated (see Results). (F) MDA-MB-231 cells were transfected with MT1-MMP-GFP alone or together with Lifeact-TagRFP and invaded in Matrigel in CIA. Cells were imaged using a spinning disc FLIM system. Fluorescence lifetime was measured in the pseudopod area and quantified from 30 cells in n = 3. Bar, 10 µm. (G) Immunofluorescence images of mCherry, mCherry-MT1-MMP, mCherry-MT1-MMPΔCT, and mCherry-MT1-MMPEZ-ABD expressing MDA-MB-231 MT-MMP knockdown cells (red) on Alexa Fluor 488–conjugated gelatin (green). The percentage of cells showing matrix degradation was quantified after 3 h incubation. At least 30 cells of each expressing construct were imaged for quantification from three independent experiments. Bar, 10 µm.
Figure 9.
Figure 9.
Model of how N-WASP, MT1-MMP, and F-actin coordinate to function during cell invasion in 3D matrices. N-WASP localizes to and concentrates at the front of invading pseudopods, where it polymerizes F-actin (green) to form actin-rich hotspots that also contain cortactin and Arp2/3 complex. MT1-MMP (red) was delivered via LE/lysosomal trafficking to the plasma membrane, where it is captured and anchored by F-actin. MT1-MMP becomes enriched at degradation sites by interacting with actin patches.

Similar articles

Cited by

References

    1. Alexander N.R., Branch K.M., Parekh A., Clark E.S., Iwueke I.C., Guelcher S.A., Weaver A.M. 2008. Extracellular matrix rigidity promotes invadopodia activity. Curr. Biol. 18:1295–1299 10.1016/j.cub.2008.07.090 - DOI - PMC - PubMed
    1. Artym V.V., Zhang Y., Seillier-Moiseiwitsch F., Yamada K.M., Mueller S.C. 2006. Dynamic interactions of cortactin and membrane type 1 matrix metalloproteinase at invadopodia: defining the stages of invadopodia formation and function. Cancer Res. 66:3034–3043 10.1158/0008-5472.CAN-05-2177 - DOI - PubMed
    1. Benesch S., Lommel S., Steffen A., Stradal T.E., Scaplehorn N., Way M., Wehland J., Rottner K. 2002. Phosphatidylinositol 4,5-biphosphate (PIP2)-induced vesicle movement depends on N-WASP and involves Nck, WIP, and Grb2. J. Biol. Chem. 277:37771–37776 10.1074/jbc.M204145200 - DOI - PubMed
    1. Branch K.M., Hoshino D., Weaver A.M. 2012. Adhesion rings surround invadopodia and promote maturation. Biology Open. 1:711–722 10.1242/bio.20121867 - DOI - PMC - PubMed
    1. Bravo-Cordero J.J., Marrero-Diaz R., Megías D., Genís L., García-Grande A., García M.A., Arroyo A.G., Montoya M.C. 2007. MT1-MMP proinvasive activity is regulated by a novel Rab8-dependent exocytic pathway. EMBO J. 26:1499–1510 10.1038/sj.emboj.7601606 - DOI - PMC - PubMed

Publication types

MeSH terms