. 2012 Oct 29;199(3):481-96.
doi: 10.1083/jcb.201201133. Epub 2012 Oct 22.

TspanC8 tetraspanins regulate ADAM10/Kuzbanian trafficking and promote Notch activation in flies and mammals

Affiliations

TspanC8 tetraspanins regulate ADAM10/Kuzbanian trafficking and promote Notch activation in flies and mammals

Emmanuel Dornier et al. J Cell Biol. .

Erratum in

Abstract

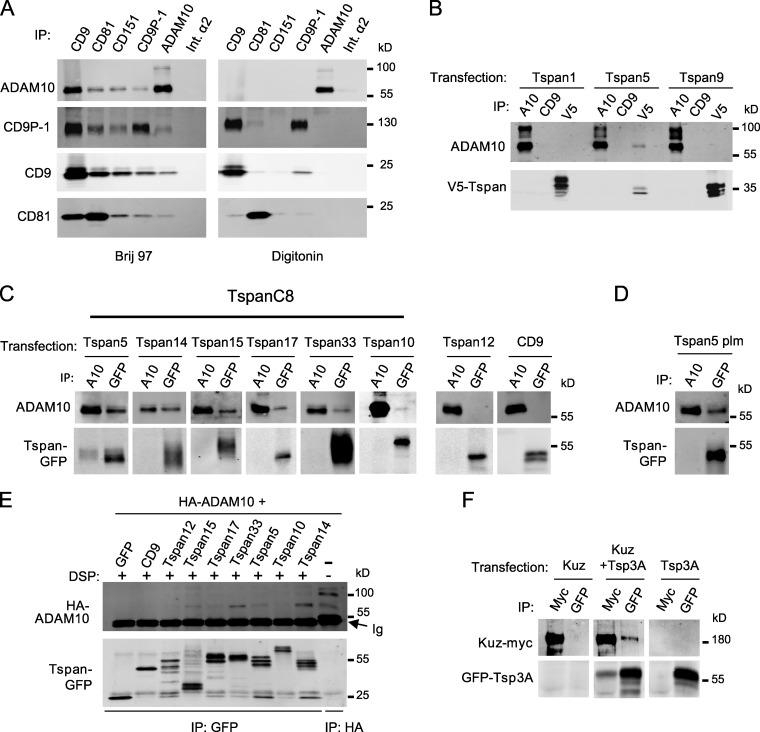
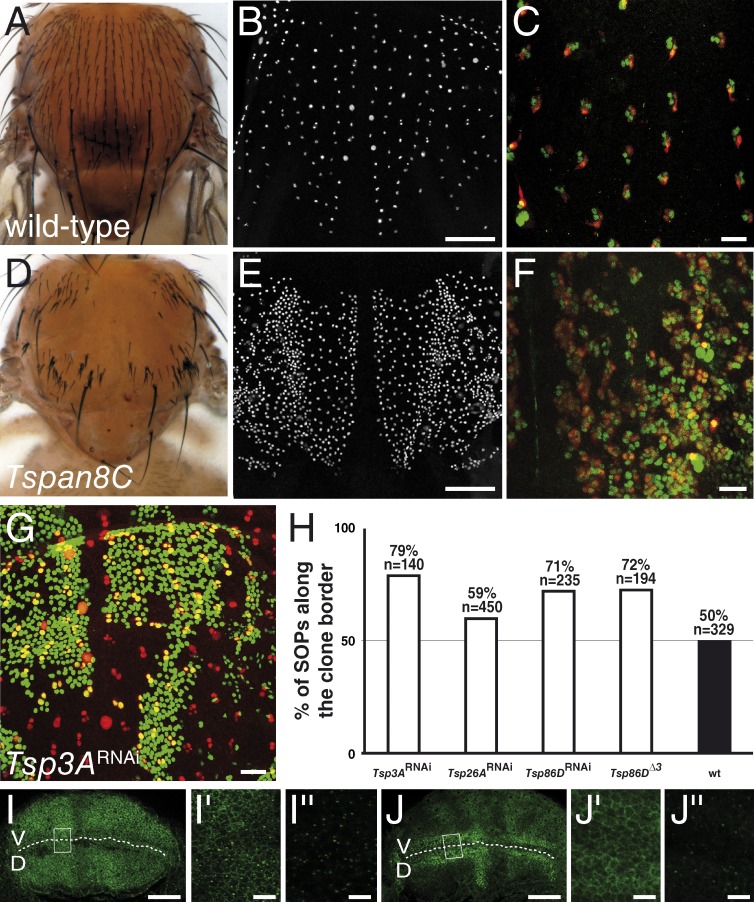
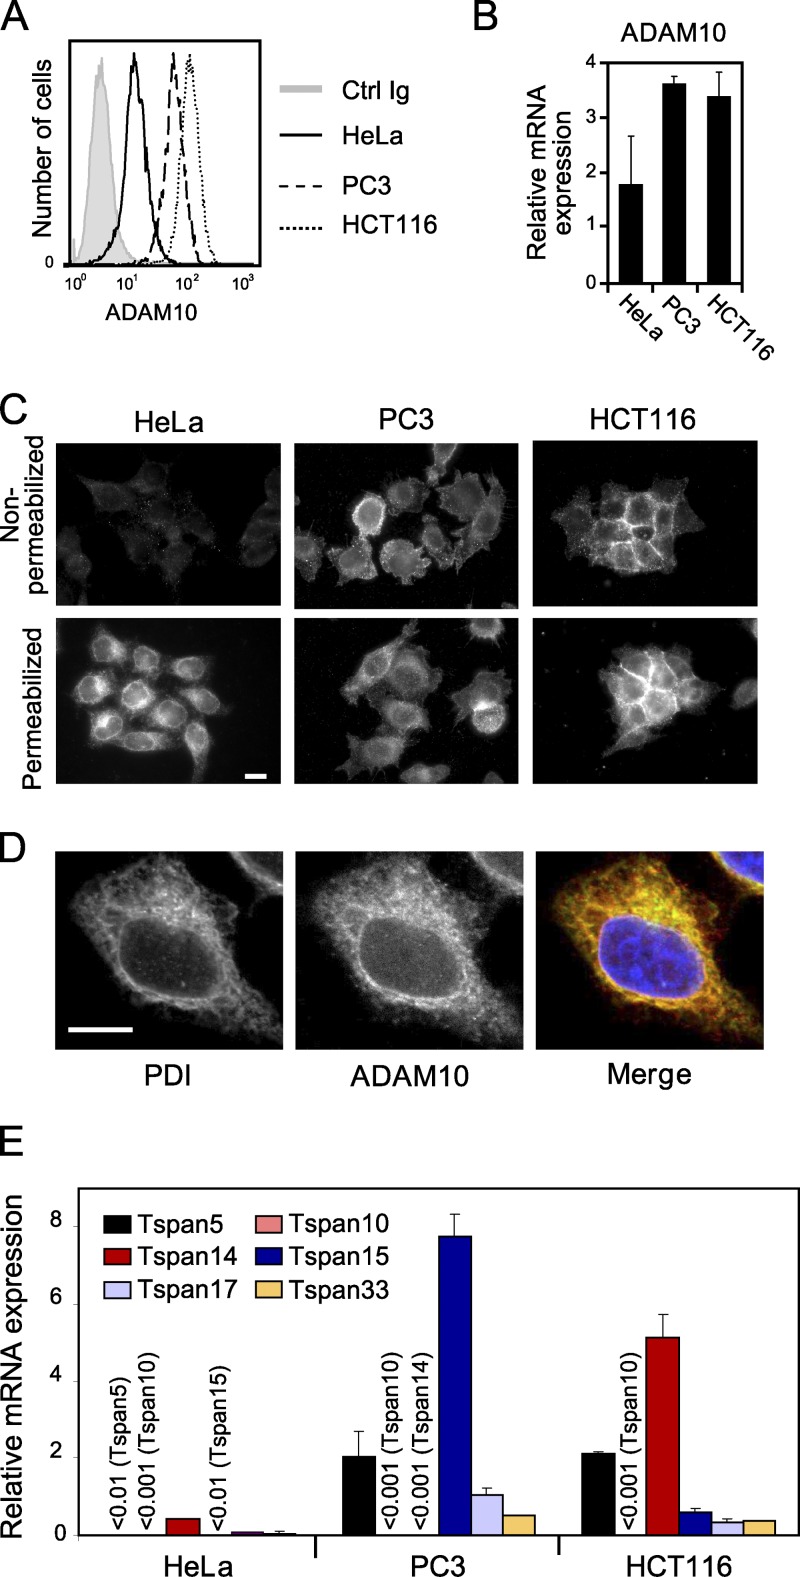
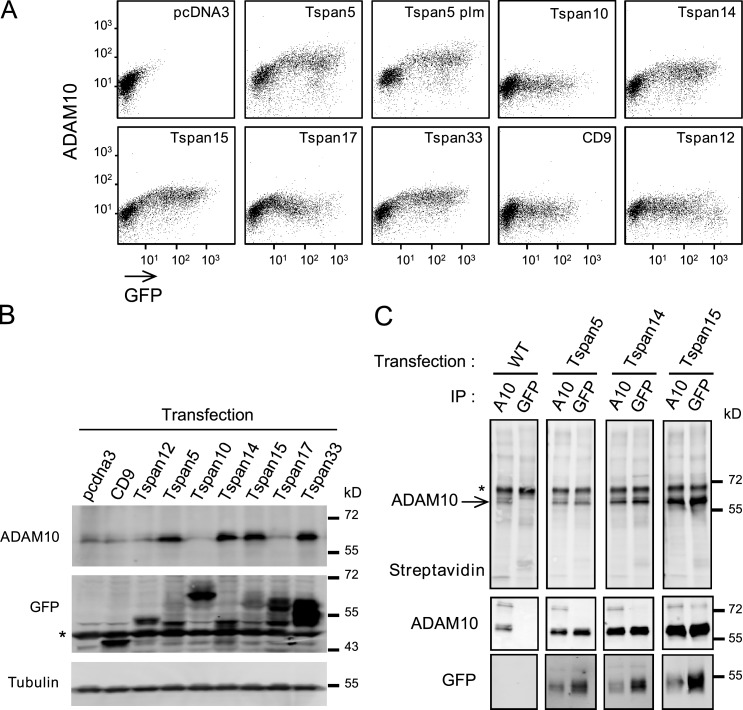
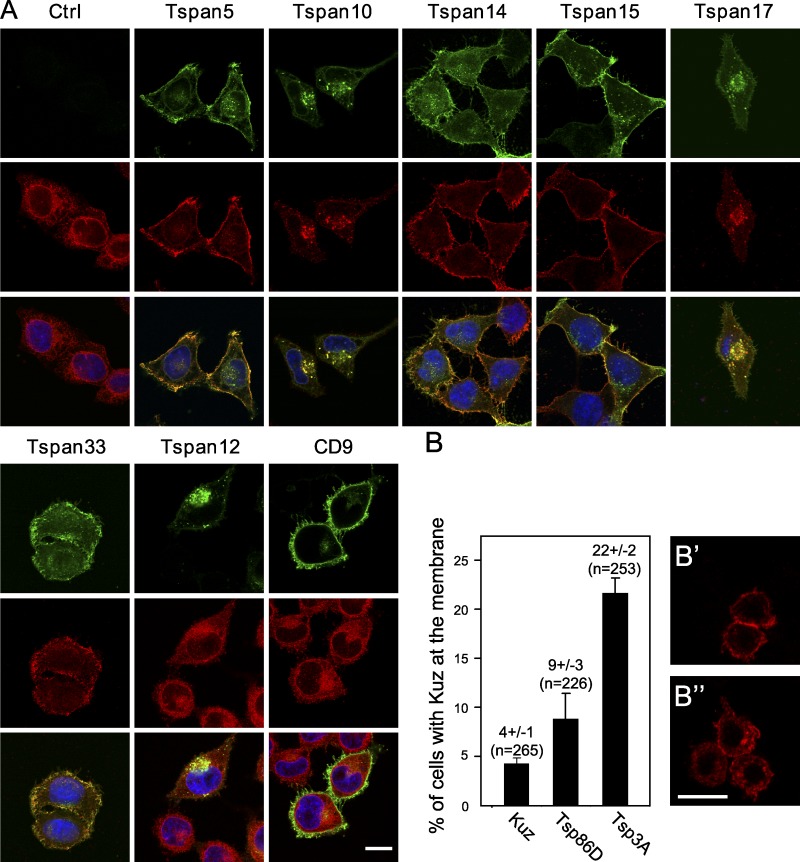
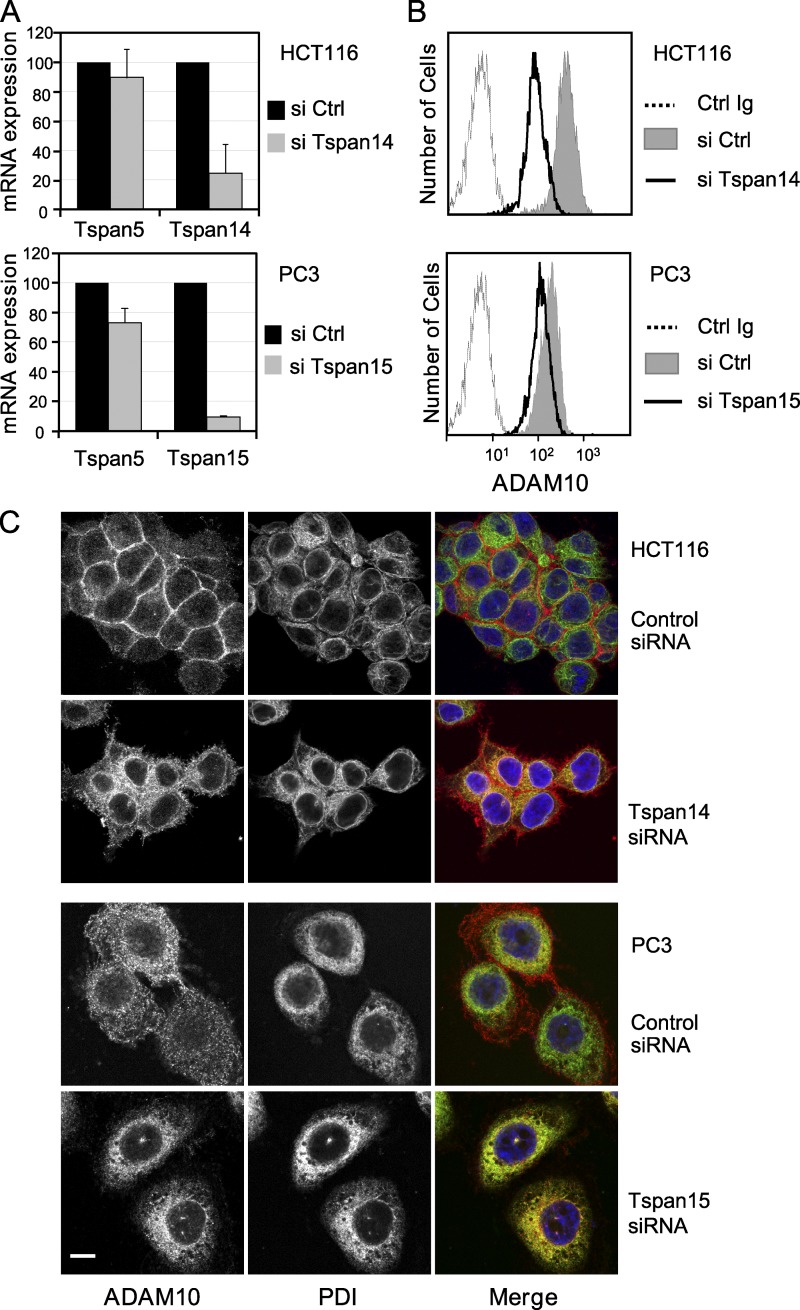
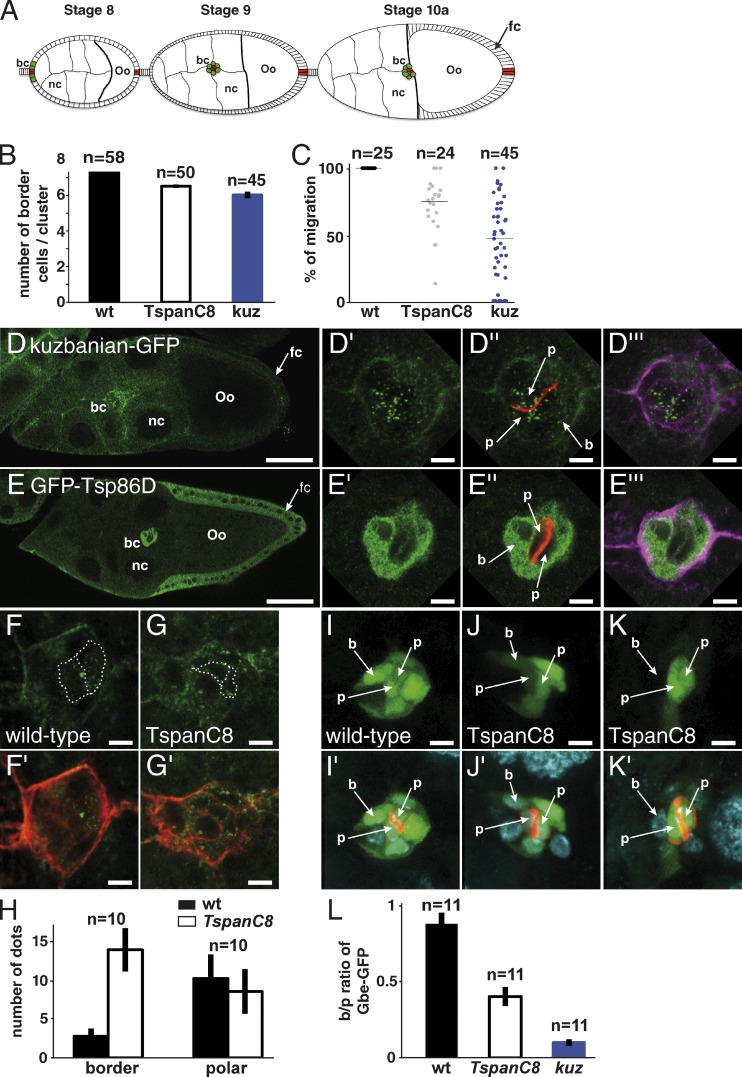
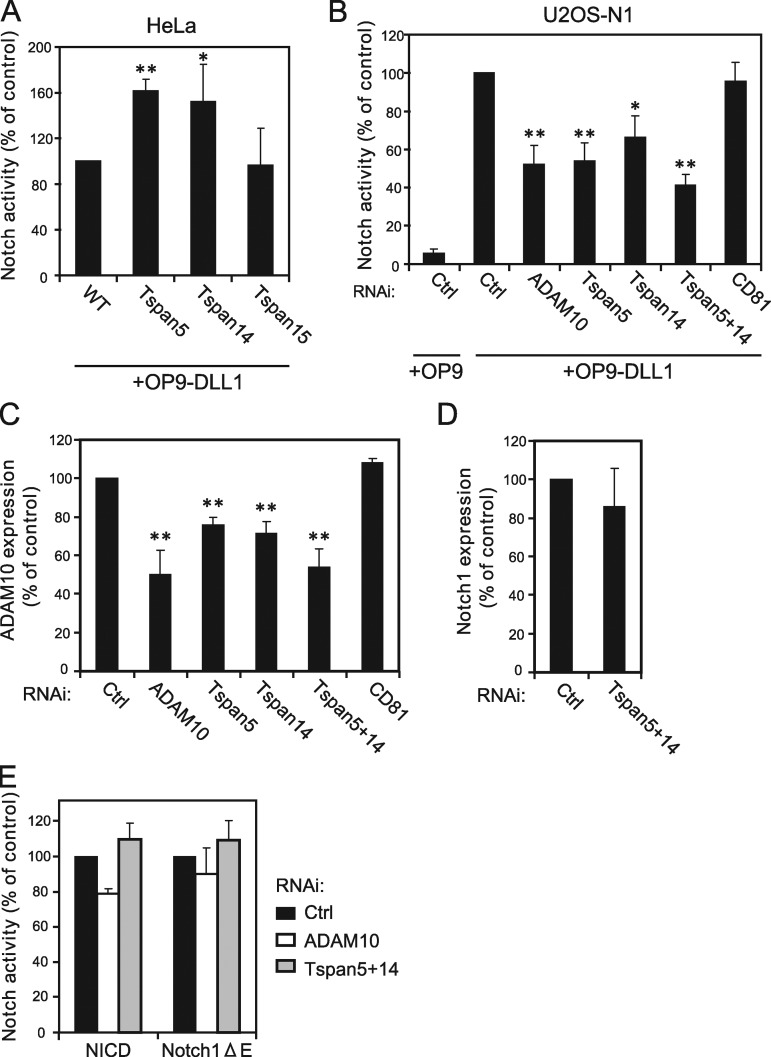
The metalloprotease ADAM10/Kuzbanian catalyzes the ligand-dependent ectodomain shedding of Notch receptors and activates Notch. Here, we show that the human tetraspanins of the evolutionary conserved TspanC8 subfamily (Tspan5, Tspan10, Tspan14, Tspan15, Tspan17, and Tspan33) directly interact with ADAM10, regulate its exit from the endoplasmic reticulum, and that four of them regulate ADAM10 surface expression levels. In an independent RNAi screen in Drosophila, two TspanC8 genes were identified as Notch regulators. Functional analysis of the three Drosophila TspanC8 genes (Tsp3A, Tsp86D, and Tsp26D) indicated that these genes act redundantly to promote Notch signaling. During oogenesis, TspanC8 genes were up-regulated in border cells and regulated Kuzbanian distribution, Notch activity, and cell migration. Furthermore, the human TspanC8 tetraspanins Tspan5 and Tspan14 positively regulated ligand-induced ADAM10-dependent Notch1 signaling. We conclude that TspanC8 tetraspanins have a conserved function in the regulation of ADAM10 trafficking and activity, thereby positively regulating Notch receptor activation.


Figures

Figure 1.
Figure 1.
Several TspanC8 tetraspanins interact with ADAM10 in a digitonin-resistant manner. (A) HCT116 cells were lysed in the presence of Brij 97 or digitonin before immunoprecipitation with the indicated mAb. The composition of the complexes was analyzed by Western blot. This experiment is representative of several experiments performed with various cell lines. Int.α2: integrin α2. (B) PC3 cells were transiently transfected with V5-tagged Tspan1, Tspan5, or Tspan9 and interaction with ADAM10 was analyzed by coimmunoprecipitation after digitonin lysis and Western blot using mAb to ADAM10 (top) or V5 tag (bottom). A10: ADAM10. (C) PC3 cells were transiently transfected with the indicated GFP-tagged tetraspanins and interaction with ADAM10 was analyzed by coimmunoprecipitation after digitonin lysis and Western blot using mAb to ADAM10 (top) or GFP (bottom). (D) Analysis of ADAM10 interaction with nonpalmitoylatable Tspan5 (Tspan5-plm) after digitonin lysis. (E) HEK 293 cells were transfected with HA-tagged ADAM10 and plasmids encoding either GFP or the indicated GFP-tagged tetraspanins. After cross-linking with DSP, the different tetraspanins were immunoprecipitated using the anti-GFP antibody. The samples were electrophoresed under reducing conditions to break the cross-linker, and the presence of ADAM10 cross-linked to the tetraspanins was detected by Western blot using an anti-HA antibody (top). The efficient immunoprecipitation of the different tetraspanins is controlled by immunoblotting the samples using an anti-GFP antibody (bottom). (F) S2 cells were transiently transfected with plasmids encoding Kuz-myc and GFP-Tsp3A, alone or in combination, and lysed using digitonin. The interaction between Kuz and Tsp3A was analyzed by immunoprecipitation and Western blotting using anti-Myc (Kuz) and anti-GFP (Tsp3A) antibodies. All experiments were performed at least twice.
Figure 2.
Figure 2.
Drosophila TspanC8 genes are required for Notch receptor signaling. (A–F) Wild-type pattern of sensory organs in adult flies (A) and of SOPs in 16 h after puparium formation (APF) pupae (B; positive for nuclear Senseless in white in B and E). At 22 h APF, each sense organ is composed of four cells (C and F; Cut in green). One of these four cells is a neuron (C and F; Elav in red). TspanC8 flies exhibited a bristle loss phenotype (D) associated with the specification of too many SOPs (E) and the transformation of external cells into internal cells, including neurons (F). TspanC8 corresponds here to the silencing of Tsp3A and Tsp26A by ap-GAL4 in a Tsp86D heterozygous background (see Table S1 for complete genotype). (G) Clones of cells silenced for Tsp3A were marked by nuclear GFP (green) in the notum of developing pupae. Competition for the SOP fate was studied by scoring the genotype (i.e., GFP) of SOPs (Senseless [Sens] in red) along clone borders. (H) Histogram showing the percentage of GFP-positive SOPs along clone borders for various genotypes (n is the number of scored SOPs). Control wild-type clones were also studied (wt). For each genotype, the distribution was significantly different from wild-type (χ2 test, P < 0.0001). (I–J′′) Wing imaginal discs stained for Notch (I–I′′) and Delta (J–J′′) from third instar larvae silenced for Tsp3A, Tsp26A, and Tsp86D using ap-Gal4 that directs transgene expression in dorsal cells (D; V is ventral; the DV boundary is indicated by a dashed line). I′, I′′, J′, and J′′ (I′ and J′: surface views; I′′ and J′′: −7 µm from the surface) show high magnification views of the area boxed in I and J, respectively. The silencing of the TspanC8 genes in D cells did not change the levels or distribution of Notch and Delta (compare with control V cells). Bars: (B and E) 100 µm; (C, F, G, I, and J) 25 µm; (I′′ and J′′) 5 µm.
Figure 3.
Figure 3.
ADAM10 localization in the ER correlates with low TspanC8 levels. (A) Flow cytometric analysis of the surface expression of ADAM10 in HeLa, PC3, and HCT116 cells. (B) RT-qPCR analysis of ADAM10 mRNA levels in HeLa, PC3, and HCT116 cells. The figure shows the mean ± SD of three independent experiments performed in triplicate. (C) Surface and intracellular expression of ADAM10 in HeLa, PC3, and HCT116 cells. Cells grown on coverslips were fixed with paraformaldehyde and permeabilized or not with 0.1% Triton X-100 before staining. The acquisition settings were the same for all conditions. This experiment was repeated at least three times. Bar, 10 µm. (D) Confocal microscope analysis of ADAM10 (red) and PDI (green) distribution in HeLa cells permeabilized with 0.1% Triton X-100. This experiment was repeated at least three times. Bar, 10 µm. (E) RT-qPCR analysis of TspanC8 mRNA levels in HeLa, PC3, and HCT116 cells. The figure shows the mean ± SD of three independent experiments performed in triplicate.
Figure 4.
Figure 4.
Expression of TspanC8 in HeLa cells increases the expression of surface and mature ADAM10. (A) Flow cytometry analysis of the surface expression of ADAM10 in HeLa cells transiently transfected with the indicated GFP-tagged tetraspanins. (B) Western blot analysis of mature ADAM10 and GFP-tagged tetraspanins in transfected HeLa cells. A nonspecific band is indicated by an asterisk. (C) After biotin labeling of surface proteins, HeLa cells stably expressing or not GFP-tagged Tspan5, Tspan14, and Tspan15 were lysed and the interaction of ADAM10 with the transfected tetraspanins was analyzed by coimmunoprecipitation and Western blot. The major 68-kD band revealed by the anti-ADAM10 mAb perfectly overlapped with the band labeled ADAM10 in the top panel. A nonspecific band is indicated by an asterisk. All experiments were performed at least twice with similar outcome.
Figure 5.
Figure 5.
TspanC8 tetraspanins regulate the subcellular distribution of ADAM10/Kuzbanian in human and Drosophila cultured cells. (A) Confocal microscopy analysis of ADAM10 localization (red) in permeabilized HeLa cells transiently transfected or not with different GFP-tagged tetraspanins (green). Bar, 10 µm. (B) Regulation of the plasma membrane localization of Kuz by Tsp86D and Tsp3A. Transiently transfected S2 cells were scored blind for the localization of Myc-tagged Kuz at the plasma membrane (as in B′) or predominantly in the cytoplasm (as in B′′). Co-transfection of GFP-Tsp86D and GFP-Tsp3A increased the percentage of cells with Kuz at the plasma membrane (B). n is the number of cells that were scored. All experiments were performed at least twice with similar outcome.
Figure 6.
Figure 6.
Endogeneous TspanC8 tetraspanins are required for ADAM10 exit from the ER. (A) Analysis of Tspan5, Tspan14, or Tspan15 expression using RT-qPCR 24 h after the initiation of Tspan14 or Tspan15 silencing in HCT116 and PC3 cells, respectively. The figure shows the mean ± SD of three independent experiments in triplicate. (B) Flow cytometric analysis of the surface expression of ADAM10 in HCT116 or PC3 cells 2 d after the initiation of Tspan14 or Tspan15 silencing, respectively. (C) Confocal microscope analysis of the distribution of ADAM10 (red) and PDI (green) in Triton X-100 permeabilized HCT116 or PC3 cells after 2 d of silencing with a control siRNA or siRNA targeting Tspan14 (HCT116) or Tspan15 (PC3). Bar, 10 µm. All experiments were performed at least twice with similar outcome.
Figure 7.
Figure 7.
Regulation of Kuz distribution and Notch signaling in Drosophila oocytes. (A) Schematic representation of egg chambers at stages 8, 9, and 10a (oo, oocyte; nc, nurse cells). Border and polar cells are color coded in green and red, respectively (bc, border cells; fc, follicular cells). (B) In wild-type ovaries, migrating clusters contain 7.8 ± 0.1 border cells. The early silencing of Tsp3A, Tsp26A, and Tsp86D in border cells using slbo-Gal4 and c306 led to a reduced number of border cells (6.5 ± 0.1), similarly to kuz silencing (6.0 ± 0.2). (C) Plots showing the raw distribution of the relative distance covered by individual clusters along the migratory path at stage 10a. In wild-type ovaries, all clusters (n = 25) have completed their migration (distance covered: 100%). The silencing of kuz and TspanC8 resulted in a significant migration delay because clusters covered only 45 ± 26% and 75 ± 16% of the total distance, respectively, at stage 10a. (D–E′′′) Distribution of Kuz-GFP and GFP-Tsp86D (anti-GFP in green) in stage 9 egg chambers. Kuz and Tsp86D were expressed in migrating somatic cells consisting of two central polar cells (p; marked by Fas3, red in D′′ and E′′) surrounded by 6–8 border cells (b; outlined by actin, violet in D′′′ and E′′′). Kuz-GFP mostly localized into dots in polar cells but was diffusely distributed in border cells (D′–D′′′). Tsp86D was expressed in border cells (E′–E′′′) and in the somatic follicular cells (fc) around the oocyte. (F–G′) The silencing of TspanC8 in border cells, i.e., the triple Tsp3A, Tsp26A, and Tsp86D RNAi using slbo-Gal4, led to the redistribution of Kuz-GFP (green) into dots in border cells (G and G′; compare with control heterozygous Kuz-GFP in F and F′; actin, red). (H) Quantification of the Kuz-GFP dots in border and polar cells. The silencing of TspanC8 in border cells specifically increased the number of Kuz-GFP dots in these cells (14 ± 3 relative to 3 ± 1 in controls). No significant effect was seen in polar cells (9 ± 3 relative to 10 ± 3 in controls). (I–K′) Notch reporter gene activity (green; Fas3, red; DAPI, blue) was detected in border (b) and polar (p) cells (I and I′). TspanC8 silencing in border cells resulted in decreased Notch reporter activity. This effect varied from medium (J and J′) to strong (K and K′). (L) Ratiometric analysis of the GFP signal from the Notch reporter Gbe-GFP in migrating border cells relative to polar cells. The silencing of TspanC8 and kuz genes (as in I–K′) led to reduced border/polar ratios in GFP intensity (0.40 ± 0.06 and 0.10 ± 0.02, respectively; wild-type was 0.88 ± 0.07). Bars: (D and E) 40 µm; (all other panels) 5 µm.
Figure 8.
Figure 8.
Tspan5 and Tspan14 regulate ligand-induced Notch activation. (A) Notch activity measured using a CSL reporter luciferase assay, of HeLa cells stably expressing or not Tspan5, Tspan14, or Tspan15. Notch was activated by incubation with OP9-DLL1 cells. The figure shows the mean ± SD of four independent experiments in duplicate. (B) U2OS-N1 cells were treated with the indicated siRNA before analysis of Notch activity produced by incubation with OP9 or OP9-DLL1 cells. The figure shows the mean ± SD of three independent experiments performed in duplicate. (C) Flow cytometric analysis of the surface expression of ADAM10 in U2OS-N1 cells treated with the indicated siRNA. The figure shows the mean ± SD of three independent experiments. (D) Flow cytometric analysis of the surface expression of Notch1 in U2OS-N1 cells treated with a control siRNA or siRNa directed to both Tspan5 and Tspan14. The figure shows the mean ± SD of three independent experiments. (E) U2OS-N1 cells were treated with the indicated siRNA and transfected with NICD and Notch1-ΔE constructs. Notch activity was determined using the luciferase assay. The figure shows the mean ± SD of three independent experiments performed in duplicate. **, P < 0.01; *, P < 0.05 as compared with control cells.

Similar articles

Cited by

References

    1. Arduise C., Abache T., Li L., Billard M., Chabanon A., Ludwig A., Mauduit P., Boucheix C., Rubinstein E., Le Naour F. 2008. Tetraspanins regulate ADAM10-mediated cleavage of TNF-alpha and epidermal growth factor. J. Immunol. 181:7002–7013. - PubMed
    1. Berditchevski F., Odintsova E., Sawada S., Gilbert E. 2002. Expression of the palmitoylation-deficient CD151 weakens the association of alpha 3 beta 1 integrin with the tetraspanin-enriched microdomains and affects integrin-dependent signaling. J. Biol. Chem. 277:36991–37000. 10.1074/jbc.M205265200 - DOI - PubMed
    1. Bischof J., Maeda R.K., Hediger M., Karch F., Basler K. 2007. An optimized transgenesis system for Drosophila using germ-line-specific phiC31 integrases. Proc. Natl. Acad. Sci. USA. 104:3312–3317. 10.1073/pnas.0611511104 - DOI - PMC - PubMed
    1. Blobel C.P. 2005. ADAMs: key components in EGFR signalling and development. Nat. Rev. Mol. Cell Biol. 6:32–43. 10.1038/nrm1548 - DOI - PubMed
    1. Boucheix C., Rubinstein E. 2001. Tetraspanins. Cell. Mol. Life Sci. 58:1189–1205. 10.1007/PL00000933 - DOI - PMC - PubMed

Publication types

MeSH terms