. 2012;7(10):e47403.
doi: 10.1371/journal.pone.0047403. Epub 2012 Oct 10.

Oroxylin-A rescues LPS-induced acute lung injury via regulation of NF-κB signaling pathway in rodents

Affiliations

Oroxylin-A rescues LPS-induced acute lung injury via regulation of NF-κB signaling pathway in rodents

Tzu-Ling Tseng et al. PLoS One. 2012.

Abstract

Background and purpose: Successful drug treatment for sepsis-related acute lung injury (ALI) remains a major clinical problem. This study was designed to assess the beneficial effects of post-treatment of oroxylin A (OroA), a flavonoid, in ameliorating lipopolysaccharides (LPS)-induced lung inflammation and fatality.

Experimental approach: Rats were injected with LPS (10 mg/kg, iv) to induce ALI, and OroA was given (15 mg/kg, iv) 1 hr or 6 hrs after LPS challenge. Twenty four hrs after LPS challenge, biochemical changes in the blood and lung tissues, and morphological/histological alterations in the lung associated with inflammation and injury were examined. Therapeutic effect of OroA was assessed by measuring the survival rate in endotoxemic mice.

Key results: LPS (10 mg/kg, iv) significantly altered WBC counts, elevated plasma tumor necrosis factor (TNF)-α and nitric oxide (NO), increased pulmonary edema, thickened alveolar septa, and decreased survival rate. These changes were ameliorated by OroA (15 mg/kg, iv) administered 1 hr or 6 hrs after LPS challenge. This post-treatment also significantly attenuated LPS-induced activation of nuclear factor-κB (NF-κB) and the release of high mobility group box 1 (HMGB1) in lung tissues. Furthermore, post-treatment with OroA (60 mg/kg, ip) administered 1 hr or 6 hrs after LPS challenge in mice significantly increased survival rate.

Conclusion and implication: OroA administered after induction of ALI by LPS significantly prevent and revere lung tissues injuries with increased survival rate. Positive post-treatment effects of OroA suggest that OroA is a potentially useful candidate for managing lung inflammation in LPS-induced endotoxemia and septic shock.


Conflict of interest statement

Competing Interests: The authors have declared that no competing interests exist.

Figures

Figure 1
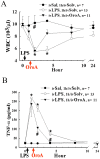
Figure 1. Effects of OroA on LPS-induced changes of the circulating WBC and plasma TNF-α level in the rats.
OroA (15 mg/kg, iv) was administered 1 hr and examined 24 hrs after LPS treatment (10 mg/kg, iv) (Panels A and B). Normal saline (Sal) or Solvent (Solv, normal saline plus Tween 80 at 9∶1 ratio) was administered as controls. Black arrow indicates LPS treatment and red arrow OroA post-treatment. Data represent means±SEM. *P<0.05 indicates significant difference from the control, and #P<0.05 indicates significantly different from the LPS alone group. n indicates the number of experiments.
Figure 2
Figure 2. Inhibition of LPS-induced lung inflammation by OroA post-treatment.
Representative sections of the rat lung tissues were stained with hematoxylin and eosin. In control section (panel Ai), normal alveoli (asterisk) and alveolar septa (arrow) with few neutrophils were shown. 24 hrs after LPS treatment (10 mg/kg, iv), thickened septa were observed in panel Aii, and inset is the enlarged area (indicated by arrowhead) of activated alveolar macrophages. Oro-A (15 mg/kg, iv) given 1 hr (panels Aiii and B) and 6 hrs (panels Aiv and B) after LPS treatment significantly reversed thickened septa when examined 24 hrs after LPS challenge. This concentration of Oro-A given 1 hr (panel Av) and 6 hrs (panel Avi) after saline (Sal) treatment did not show any effect when examined 24 hrs after LPS challenge. Panel C indicates that the enhanced lung wet-to-dry weight (W/D) ratio following LPS treatment (10 mg/kg, iv) was reversed by OroA treatment (15 mg/kg, iv) administered 1 hr or 6 hrs after LPS challenge. In panel D, LPS (10 mg/kg, iv) significantly increased lung injury score comparing to that of Sal (normal saline) control when examined 24 hrs (E/24h) after LPS challenge. The increase was reversed significantly by OroA (15 mg/kg, iv) administered 1 hr or 6 hrs after LPS challenge. Solv, normal saline plus Tween 80 at 9∶1 ratio; hr/Posttreat (post-treatment hour after LPS treatment); E/hr (examination hour after LPS challenge). Data are means±SEM. *P<0.05 indicates significant difference from the normal control (ivSal-ivSolv) group. #P<0.05 indicates significantly different from the respective (1 hr or 6 hrs) LPS alone (ivLPS-ivSolv) group. The number in each column represents the number of rats used. Scale bar, 50 µm.
Figure 3
Figure 3. OroA inhibition of LPS-induced plasma NO and expression of iNOS in the lung tissues of the rats.
Panel A indicates plasma NO concentrations in control (Sal followed by Solv), LPS (10 mg/kg, iv) followed by Solv-treated, and LPS followed by OroA-treated (15 mg/kg, iv) groups. OroA was administered 1 hr (panel A) or 6 hrs (panel B) and examined 24 hrs (E/24h) after LPS challenge. Data are means±SEM. *P<0.05 indicates significant difference from the normal control. #P<0.05 indicates significantly different from the LPS 1 hr or 6 hrs after LPS challenge. n indicates the number of experiments. In panel Ci, iNOS immunoreactivities (dark brown color) in rat terminal bronchioles (TB) and clara cells (inset of enlarged area indicated by arrows in Fig Ci and ii) were significantly expressed 24 hrs after LPS (10 mg/kg, iv) treatment. The expression was inhibited by OroA (15 mg/kg, iv) administered 6 hrs and examined 24 hrs (E/24h) after LPS challenge (panel Cii). The enhanced iNOS protein production induced by LPS (Lane 2 in panel D) and its inhibition by OroA (15 mg/kg, iv) administered 1 hr (Lane 3 in panel D) or 6 hrs after LPS (lane 5 in panel D). Actin levels were served as internal control. The results are summarized as the relative density (%) of iNOS production. hr/Posttreat (post-treatment hour after LPS treatment); E/hr (examination hour after LPS challenge). Data are means±SEM. *P<0.05 indicates significant difference from the control (Sal followed by Solv, Lane 1 in panel D). #P<0.05 indicates significant difference from the respective LPS alone (ivLPS-ivSolv) group (Lanes 2 and 4 in panel D). Scale bar = 20 µm. The number in each column represents the number of rats examined.
Figure 4
Figure 4. OroA attenuation of LPS-induced HMGB1 release in lung tissue.
Comparing to Sal (saline) control (Lane 1), LPS (10 mg/kg, iv) significantly enhanced nuclear HMGB1 release into cytosolic fraction in lung tissue. The increased release was inhibited by OroA (15 mg/kg, iv) administered 1 hr (Lane 3) or 6 hrs (Lane 5) after LPS (Lane 4) challenge. The relative percent of cytosolic HMGB1 protein release was normalized to actin which served as an internal control, and summarized as the relative density (%) of cytosolic HMGB1 expression. Solvent (Solv, normal saline plus Tween 80 at 9∶1 ratio); hr/Posttreat (post-treatment hour after LPS treatment); E/hr (examination hour after LPS challenge). Data are means ± SEM. *P<0.05 indicates significant difference from the normal control (Lane 1). #P<0.05 indicates significant difference from LPS alone (ivLPS-ivSolv in Lanes 2 and 4). The number in each column represents the number of rats examined.
Figure 5
Figure 5. OroA inhibition of LPS-induced IκB degradation in lung tissue.
Comparing to control group (Sal followed by Solv-treatment in Lane 1), LPS treatment (10 mg/kg, iv) significantly caused IκB degradation (Lanes 2 and 4). This effect, examined 24 hrs (E/24h) after LPS challenge, was prevented by OroA (15 mg/kg, iv) administered 1 hr (Lanes 3) or 6 hrs (Lane 5) after LPS challenge. The relative percent of total IκB was normalized to actin which served as an internal control, and was summarized as relative density (%). Sal (Saline); Solvent (Solv, normal saline plus Tween 80 at 9∶1 ratio); hr/Posttreat (post-treatment hour after LPS treatment); E/hr (examination hour after LPS challenge). Data are means±SEM. *P<0.05 indicates significant difference from the control (Lane 1). #P<0.05 indicates significant difference from the LPS alone group (Lanes 2 and 4). The number in each column represents the number of rats examined.
Figure 6
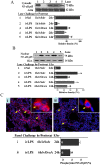
Figure 6. OroA inhibition of LPS-induced NF-κB activation in lung tissue of the rats.
LPS treatment (10 mg/kg, iv) significantly decreased cytosolic NF-κBp65 expression in lung tissue (Lane 2 in Fig. 6A) comparing to that by Sal (Saline) followed by Solv (Solvent) treatment (Lane 1 in Fig. 6A). The reduction examined (E) 24 hrs after LPS challenge (Fig. 6A) was significantly reversed to similar extent by treatment with OroA (15 mg/kg, iv) administered 1 hr (Lane 3 in Fig. 6A) or 6 hrs (Lane 5 in Fig. 6A) after LPS. Bar graphs summarized the relative density (%) of cytosolic NF-κB protein that was normalized to actin (Fig. 6A). In parallel, LPS treatment (10 mg/kg, iv) significantly increased nuclear p65 expression (Lanes 2 and 4 in Fig. 6B) comparing to that by Sal followed by Solv treatment (Lane 1 in Fig. 6B). The increase examined 24 hrs after LPS challenge was significantly reversed to similar extent by treatment with OroA (15 mg/kg, iv) administered 1 hr (Lane 3 in Fig. 6B) or 6 hrs (Lane 5 in Fig. 6B) after LPS challenge. Bar graphs summarized the relative density (%) of nuclear NF-κB protein that was normalized to H2A. Solvent (Solv, normal saline plus Tween 80 at 9∶1 ratio); hr/Posttreat (post-treatment hour after LPS treatment); E/hr (examination hour after LPS challenge). Data are means ± SEM. *P<0.05 indicates significant difference from the normal control (Sal followed by Solv, Lane 1 in panels A and B). #P<0.05 indicates significant difference from the respective LPS treated group (LPS followed by Solv) (Lanes 2 and 4 in Figs. 6A and 6B) when examined 24 hrs after LPS challenge. The number in each column represents the number of rats examined. Fig. 6Ci indicates effects of LPS (10 mg/kg, iv) administered 6 hrs after LPS challenge on phosphorylated p65 cells in red (indicated by yellow arrows in panels Ci and Cii) which were examined 24 hrs (E/24h) after LPS challenge. Phosphorylated NF-κB p65 cells were significantly reduced by OroA (15 mg/kg, iv) administered 6 hrs after LPS challenge (panel Cii). Phosphorylated NF-κBp65 cells were calculated from randomly selected 4 fields with a total of 200 cells. Insets are enlarged areas indicated by white arrowheads denoting phosphorylated NF-κBp65 translocated into the nuclei. The nucleus in blue color was stained with DAPI. Data are means±SEM. #P<0.05 indicates significantly different from the LPS plus Solv-treated group. Scale bar, 20 µm. The number in each column represents the number of rats examined.
Figure 7
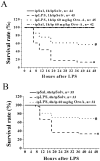
Figure 7. OroA improved the survival rate of endotoxemic mice.
LPS treatment (100 mg/kg, ip) significantly decreased the survival rate in B6 mice (Panel A and B). The decrease was prevented by Oro-A (60 mg/kg, ip) administered 1 hr (Panel A) or 6 hrs (Panel B) after LPS challenge. Mice received Sal followed by Solv (ip) and Sal followed by OroA (60 mg/kg, ip) served as controls. *P<0.05 and #P<0.05 indicate significant difference from the control (Sal followed by Solv) group and LPS followed by Solv group, respectively. n indicates the number of experiments.

Similar articles

Cited by

References

    1. Dreyfuss D, Ricard JD (2005) Acute lung injury and bacterial infection. Clin Chest Med 26: 105–112. - PubMed
    1. Baumgarten G, Knuefermann P, Wrigge H, Putensen C, Stapel H, et al. (2006) Role of Toll-like receptor 4 for the pathogenesis of acute lung injury in Gram-negative sepsis. Eur J Anaesthesiol 23: 1041–1048. - PubMed
    1. Chen HI, Kao SJ, Wang D, Lee RP, Su CF (2003) Acute respiratory distress syndrome. J Biomed Sci 10: 588–592. - PMC - PubMed
    1. Gu J, Korteweg C (2007) Pathology and pathogenesis of severe acute respiratory syndrome. Am J Pathol 170: 1136–1147. - PMC - PubMed
    1. Jiang Y, Xu J, Zhou C, Wu Z, Zhong S, et al. (2005) Characterization of cytokine/chemokine profiles of severe acute respiratory syndrome. Am J Respir Crit Care Med 171: 850–857. - PubMed

Publication types

MeSH terms

Grants and funding

Tzu-Chi University Grants TCMRC-C95005-01, TCRPP99006, TCIRP 98005-01 and TCIRP 98005-02, and National Science Council of Taiwan Grants NSC-NSC-95-2320-B-320-013-MY2, NSC-96-2320-B-320-005-MY3 and NSC 100-2320-B-320-007-MY2, Buddhist Tzu Chi General Hospital Grant TCRD98-34, and the Tzu Chi Foundation. The funders had no role in study design, data collection and analysis, decision to publish, or preparation of the manuscript.