Comparative study of human and mouse postsynaptic proteomes finds high compositional conservation and abundance differences for key synaptic proteins
- PMID: 23071613
- PMCID: PMC3465276
- DOI: 10.1371/journal.pone.0046683
Comparative study of human and mouse postsynaptic proteomes finds high compositional conservation and abundance differences for key synaptic proteins
Abstract
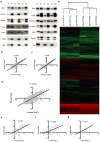
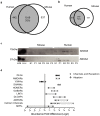
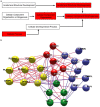
Direct comparison of protein components from human and mouse excitatory synapses is important for determining the suitability of mice as models of human brain disease and to understand the evolution of the mammalian brain. The postsynaptic density is a highly complex set of proteins organized into molecular networks that play a central role in behavior and disease. We report the first direct comparison of the proteome of triplicate isolates of mouse and human cortical postsynaptic densities. The mouse postsynaptic density comprised 1556 proteins and the human one 1461. A large compositional overlap was observed; more than 70% of human postsynaptic density proteins were also observed in the mouse postsynaptic density. Quantitative analysis of postsynaptic density components in both species indicates a broadly similar profile of abundance but also shows that there is higher abundance variation between species than within species. Well known components of this synaptic structure are generally more abundant in the mouse postsynaptic density. Significant inter-species abundance differences exist in some families of key postsynaptic density proteins including glutamatergic neurotransmitter receptors and adaptor proteins. Furthermore, we have identified a closely interacting set of molecules enriched in the human postsynaptic density that could be involved in dendrite and spine structural plasticity. Understanding synapse proteome diversity within and between species will be important to further our understanding of brain complexity and disease.
Conflict of interest statement
Figures


Similar articles
-
Evolution of complexity in the zebrafish synapse proteome.Nat Commun. 2017 Mar 2;8:14613. doi: 10.1038/ncomms14613. Nat Commun. 2017. PMID: 28252024 Free PMC article.
-
Human post-mortem synapse proteome integrity screening for proteomic studies of postsynaptic complexes.Mol Brain. 2014 Nov 28;7:88. doi: 10.1186/s13041-014-0088-4. Mol Brain. 2014. PMID: 25429717 Free PMC article.
-
Alteration of synaptic protein composition during developmental synapse maturation.Eur J Neurosci. 2024 Jun;59(11):2894-2914. doi: 10.1111/ejn.16304. Epub 2024 Apr 3. Eur J Neurosci. 2024. PMID: 38571321 Review.
-
Dynamics of the mouse brain cortical synaptic proteome during postnatal brain development.Sci Rep. 2016 Oct 17;6:35456. doi: 10.1038/srep35456. Sci Rep. 2016. PMID: 27748445 Free PMC article.
-
Quantification of postsynaptic density proteins: glutamate receptor subunits and scaffolding proteins.Hippocampus. 2012 May;22(5):942-53. doi: 10.1002/hipo.20950. Epub 2011 May 18. Hippocampus. 2012. PMID: 21594948 Review.
Cited by
-
Characterizing synaptic protein development in human visual cortex enables alignment of synaptic age with rat visual cortex.Front Neural Circuits. 2015 Feb 12;9:3. doi: 10.3389/fncir.2015.00003. eCollection 2015. Front Neural Circuits. 2015. PMID: 25729353 Free PMC article.
-
ASTN2 modulates synaptic strength by trafficking and degradation of surface proteins.Proc Natl Acad Sci U S A. 2018 Oct 9;115(41):E9717-E9726. doi: 10.1073/pnas.1809382115. Epub 2018 Sep 21. Proc Natl Acad Sci U S A. 2018. PMID: 30242134 Free PMC article.
-
SynGO: An Evidence-Based, Expert-Curated Knowledge Base for the Synapse.Neuron. 2019 Jul 17;103(2):217-234.e4. doi: 10.1016/j.neuron.2019.05.002. Epub 2019 Jun 3. Neuron. 2019. PMID: 31171447 Free PMC article.
-
FMRP and CYFIP1 at the Synapse and Their Role in Psychiatric Vulnerability.Complex Psychiatry. 2020 Oct;6(1-2):5-19. doi: 10.1159/000506858. Epub 2020 Mar 3. Complex Psychiatry. 2020. PMID: 34883502 Free PMC article. Review.
-
Analysis of synaptic gene expression in the neocortex of primates reveals evolutionary changes in glutamatergic neurotransmission.Cereb Cortex. 2015 Jun;25(6):1596-607. doi: 10.1093/cercor/bht354. Epub 2014 Jan 9. Cereb Cortex. 2015. PMID: 24408959 Free PMC article.
References
-
- Bayés A, Grant SG (2009) Neuroproteomics: understanding the molecular organization and complexity of the brain. Nat Rev Neurosci 10: 635–646. - PubMed
-
- Husi H, Ward MA, Choudhary JS, Blackstock WP, Grant SG (2000) Proteomic analysis of NMDA receptor-adhesion protein signaling complexes. Nature neuroscience 3: 661–669. - PubMed
-
- Collins MO, Husi H, Yu L, Brandon JM, Anderson CN, et al. (2006) Molecular characterization and comparison of the components and multiprotein complexes in the postsynaptic proteome. J Neurochem 97 Suppl 1: 16–23. - PubMed
Publication types
MeSH terms
Substances
Grants and funding
LinkOut - more resources
Full Text Sources
Molecular Biology Databases
Miscellaneous

